FOREX PRO Weekly August 27-31, 2012

guys, if you are interested in Morgan Stanley's report for the next couple weeks/months, here it is attached. makes for interesting reading that's for sure. enjoy.

Interesting stuff! Is this publicly available or is it a paid for service? I'd like to read analysis like this cos I understand technical analysis but have no clue about fundamentals...

All the best

Michael
 
Nasdaq

Guys,
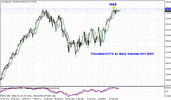
I would like to show you NASDAQ daily chart. Although DRPO has not been confirmed yet - but if you trade equities - be careful
 

Attachments

  • nsdq_drpo.gif
    nsdq_drpo.gif
    25.7 KB · Views: 39
i love it when even the experts don't know what the hell is going on: 'we are still at something of a loss to explain why the EUR is proving so resilient given the recent data that has shown that not even Germany is immune from the wider Eurozone malaise.' that's from 4cast.com. if they can't figure it out, then how could i possibly figure it out? always make me feel better. ;)
 
Yeah Triantus. This argument probably could give some relief if you have no open long-term positions at big amount of money ;)
 
Yeah Triantus. This argument probably could give some relief if you have no open long-term positions at big amount of money ;)

Hi Sive

I found when all your indicators are on the bullish side, the market turns bearish.
 
Hey Sive,

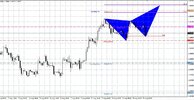
I know in your analysis yesterday you said that a retracement to 50% for butterfly is good, but is this pattern still valid even though market attempted push up from 50.0 support? Or has this pattern failed because the pattern found support at 50% but failed to continue up? Can we say that this 78.6 support is the last stand to validate this H4 butterfly?

Market pushed down to 1.2500 area but still above WPP and important support area (1.246x)

Right now, market stands exactly at 78.6 support of A-B leg of butterfly.

Thanks, Sive!

h4butterfly.jpg
 
i understand that the A and C of the internal AB=CD of a butterfly could be at the same level, that is, A=C in the most non-standard case and the butterfly is still valid. right now, price could still bounce back up to complete the right wing.

there is an AB=CD structure inside the BC leg. check whether price has hit the 127.2 or 161.8 extension. and if 161.8 extension is >= C or <= C.

also downside thrust is pretty good. SP500 started to turn lower and so has gold but not to significant levels yet. but e/u is holding right at trend line SPPT on H1. so... as much as i would like to be able to say it's gonna go this way or that, this whole setup looks more and more like a wolf waiting to spring a trap. the quiet before the storm. i think anything could happen here. like a huge snapback up. it's gonna be interesting to see the size of the spikes when the bernank speaks later today.
 
Back
Top