FOREX PRO WEEKLY July 28-01 August, 2014

Still we see interesting phenomenon on JPY, but it stands on weekly chart and we will discuss it below.

Hi Sive, thanks for the analysis.
I'm missing the discussion about JPY that you commented at the beginning. I'm unable to find to what it refers.
Thanks!
 
Dear Sive

thank you for our continuous support to us .

Taking the chance of us waiting for news end of this week, perhaps you could spend some time during the transcourse of this week and explain a bit more in depth how you did decide on position of Yearly Pivot . It works so well as reference during first half of this year, that I think I should understand much better , how you fixed the 1,3475 .

Starting point for some additional words could be your respective lesson : https://www.forexpeacearmy.com/fore...49-forex-pro-weekly-january-06-10-2014-a.html

in which you explained us


Thank you in advance / Spasiba :)

Best regards
KB

Hi KB,
In fact, yearly pivots calculate by using the same formulas as any other - weekly, monthly etc. Thus, to get YPP = (H+L+C)/3 You need to use High, Low and Close of previous Year. As in MT4 we have only monthly charts as biggest one. You will have to watch for all 12 months of 2013 year, find low of the year, high of the year and close. And you'll get it.
YPS1 and YPR1 you can calculate using formulas that we've specified in corresponding chapter in our Forex full Course.

Hi Sive, thanks for the analysis.
I'm missing the discussion about JPY that you commented at the beginning. I'm unable to find to what it refers.
Thanks!

Hi Buddy,
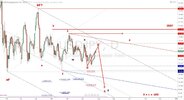
Looks like I forget about it. Ha-ha-ha. Was too focused on EUR. Right... Actually I mean bullish dynamic pressure on weekly JPY. It suggests upward jump above the highs of current year. Usually any jump on weekly has a fundamental reason, but right now it is difficult to suggest which one. Anyway, It stands in USD strength or JPY weakness.
jpy_w_28_07_14.png

Hello

Hope you enjoy(ed) weekend.

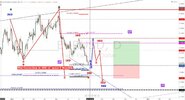
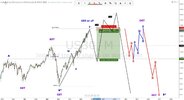
Here is H4 chart..I think move is not done and expect sideways, relatively nice moves, full of zigzags to finish red 5th wave as ED up to FOMC.
If I am correct we should go long and stop between 1,3575 and 1,3650, i like 1,3620..but we should stay in this zone until next week...If we jump above 1,3650 i think it is most probable we run to hit 1,3750 and maybe higher but about such development later..in such case we get another pattern..


Good trading in coming week!


View attachment 16057

Hi Mmax, well this is brave assumption. So, does it mean that you suggest negative surprise for USD from the Fed? Also, If we will get this upward bounce - we might get monthly grabber and it will suggest move to 1.40+... Interesting.
 
Hi Mmax, well this is brave assumption. So, does it mean that you suggest negative surprise for USD from the Fed? Also, If we will get this upward bounce - we might get monthly grabber and it will suggest move to 1.40+... Interesting.

Hi Sive

I confess whole pattern is suspicious..but ˝price action mechanics˝ ,as you say, suggest me 5 waves pattern to make 4ED on higher TF so we should go up as I wrote, or Flat for deeper correction if wave c on MONTHLY (I wrote weekly, wrong, corrected!) is in placewhat means up again...unfortunately for bulls there is an option we just sink if 1st move down on weekly would be accepted as 1st of an impulse...hope you will see what I mean from my picture..
SG would come in play next month..

201407_eurusd_daily_0824.jpg
 
Last edited:
Larry Williams Forecast 2014

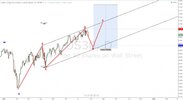
Good friend sent me Larry Williams Mid Year Foreacst 2014 where Mr. Willams warns that DJ is just before correction in next days, weeks...
I checked and really find pattern that suggests we are nesting high...it is very complicated, full of zigzags so HH could alredy be in place but I expect one more push up in next days, ZZ family pattern on daily an H4 and then sinking! LW says until October...


20140728_dji_daily_0838.jpg
 
Larry Williams Forecast 2014

Mr. Williams also suggests to sell oil in near future...

Here is my chart, I sent it weeks ago...I read this as ZZ with CT as correction...well I am really not prepare to claim we will drop below 32...but we could get more complax correction and drop to 50% of blue abc...
This chart is ugly because it has price action of last year covered with labels but just to get bigger picture..I think ZZ is developing to downside but if as a part of Flat or as 1ED, this I do not want to claim.

20140728_usoil_monthly_0854.jpg


Here is daily for last year with patterns I see..Move down I read as ZZ, so aF or 1stZZ of DZZ or 1ED...now we are in ED of wave c of correction..I expect to make high around 110, if my count is correct of course, and drop below 91, and potentialy very lower....I update this pattern for longer time and I must say so far usoil behaves very nice..

20140728_usoil_daily_0900.jpg
 
Larry Williams Forecast 2014

Mr. Williams expects jpy strenghtening...

I am expecting ED to downside for some months...and jpy makes me angry with this sideways...and suspicious..3ED is very out of time lenght expectatins...BUT nobody is pefect, right,hehe..where surprise could be hidden? well I read move up (red 1 at 100,81) as Flat on H4 and here might be The catch..IF it is ZZ, then we are in ED to the upside! BUT I am not bullish though. To me this ED would be cF and leg now labeled a would become 1 of an impulse..BUT I do not like this pattern, goes not nicely on hight TFs.
I remain with my picture as ED, 102,25 is level, if broken, to reconsider..


20140728_usdjpy_daily_0922.jpg
 
Larry Williams Forecast 2014 - euro currency

Last of his forecasts in this thread because I think we are not intersted in lumber, soybeans, treasury bonds...

About euro Mr. Williams is very cautios...he speaks about positions of non-commercials...he expects euro strenghtening..

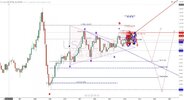
Here is my big picture..from July 2008 1,6037...I spoke about D3, Flat with low 1,1875 and Flat corrective but I am more&more sceptical about it...
..here I see 2 possibilities..maybe you will find my chart messy but it is as it is, to me is clear&understandable...
1. to me closest is Flat with ED wave c...red W is aF, X is bF, 1ED in place and we are in Flat corrective 2ED in wave cF as ED...here is the question I spoke about in my eurusd insigh...how to unfold ED..is wave c = 1ED in place or not..how deep...this is what we will get in near future..how high is also the matter of future BUT not above 1,5143..if this is 2ED..
In this picture I drew second option as Flat, HH as wave c monthly in place, meanwhile in daily insight there is ED as cF 4ED, HH not in place..
2. this pattern I do not like because I respect swings most of all...this one could be CT..W = wave a (this is why I do not like because it looks lake nice ZZ), than combined/complex ZZ into ACT, then BCT, CCT and DCT (all acceptable) and we are in E...here is THE catch..E could be in place and we are headed toward parity...or this is 1st ZZ of DZZ wave E with target above current HH and all the way to 1,4927...E can also be CT so we could get ups&downs in future but this I do not like again!

Good trading to all and good luck with fastfingers at FOMC!
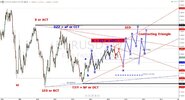

20140728_eurusd_weekly_0955.jpg

ps
There is a mistake in my chart, blue 5ED is on wrong high, should be on 1,3992 peak..sorry, not on purpose..
 
Last edited:
DOW JONES - What is going on?

This is strange and horrible prediction!

In next days I see DJ should sink a lot, so what will happen to US$, euro, gold.. ???

I read 2 patterns...

1. ZZ with ED as wave c...and
2. Expanding triangle where we supposed to be in aFlat now, nesting high...(most horrible would be we are to make DZZ EET in next days.......maximal level for EET is 138,2% extension which is at 17132, current high of this leg is 17148.....)

In both cases we should drop a lot...in 1st scenario to hit high of A in 2nd to hit 50% !!
In 1st scenario we can go very high, in 2nd I expect double top.
Looks like very soon we will face last attempt of our politicians to save world economy, but will fail, just a question of version...

There is hidden scenario, based on quarterly, that high in nesting would be 3 of an impulse..In this case my horrible analysis is too early and we will get retrace to 24-38%.

Well I am not Nostredamus so lets see if my analysis is correct.


20140728_dji_monthly_1158.jpg
 
Last edited:
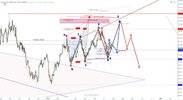
eurusd

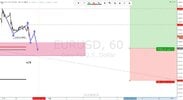
I expected bigger ED but looks like we have an impulsive 5th on H4 with ED in 5th on smaller degree..so I expect those zigzags I expected on Sunday... on the right side of picture is my long trade assumption from Sunday..

20140729_eurusd_H1_1509.jpg
 
Back
Top