Hi Sam,
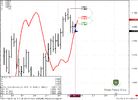
Both of the ways, that you've talked about are valid. This is a question of time. The longer time distance between A-B-C points the longer it will develop. So, if you're short term trader, you should peak most recent ABC's. But also be aware of large ABC - because if you don't know them, they could negatively surprise you, when market will hit it...
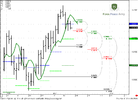
The well-reliable ABC pattern has a thrust move on AB leg. C point should lay inside AB swing. And it's better if BC leg is meaningful retracement - not less than 0.382.
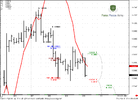
Well, I do not use trend line, definitely speaking - I do not trade them and rely on them. trend line in research was, just for notification of upward move, but not a strictly trend that could be used for trading.
Hi Sive,
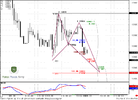
This is for the Fibonacci expansion, that mean we should be drawing the Fibonacci retracement first to get the 0.382 level or lower ~ 0.682 than we can draw the Fibonacci expansion based on the retracement or the BC leg. Is that correct?
Sam