Sive Morten
Special Consultant to the FPA
- Messages
- 18,654
No, this will be bullish stop grabber.
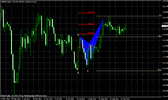
This pattern suggests upward move.
This pattern suggests upward move.
I am certainly not nearly as experienced as Sive but I thought I might give this a try and please correct me if I am wrong.Hello Mr. Morten!
I have a theoretical question about targets. I waited and waited but this situation seems to freeze so I decided to ask for an opinion. In a situation like one on the GBPJPY would it be reasonable to expect reaching of the 1.618 target? The butterfly worked perfectly to minimum 0.382 retracement but now price is consolidating. In such a situation (assuming that there is no ECB meeting on the horizon), should I expect an up move for completing the 1.618 target?
Thank you!

If there is a stop grabber on daily, it means market will probably go down?
Georgeta,
first noticed you used expansion instead extension and second - just measure on seen fractals. Pattern was done in pip, so to say.
View attachment 6530
Hello minimaxGeorgeta,
first noticed you used expansion instead extension and second - just measure on seen fractals. Pattern was done in pip, so to say.
View attachment 6530
Hello minimax
What's the differnce between expansion and extension and how do you apply any of them on the mt4 platform??
Thanks