Lewis Glasgow
SixFigureCapital Representative
- Messages
- 64
Harmonic Trading (06 February 2018)
EUR/USD: Bullish Gartley
Following up from my previous successful bullish gartley for EUR/USD, we've now got another bullish gartley but this time on the 30m chart.
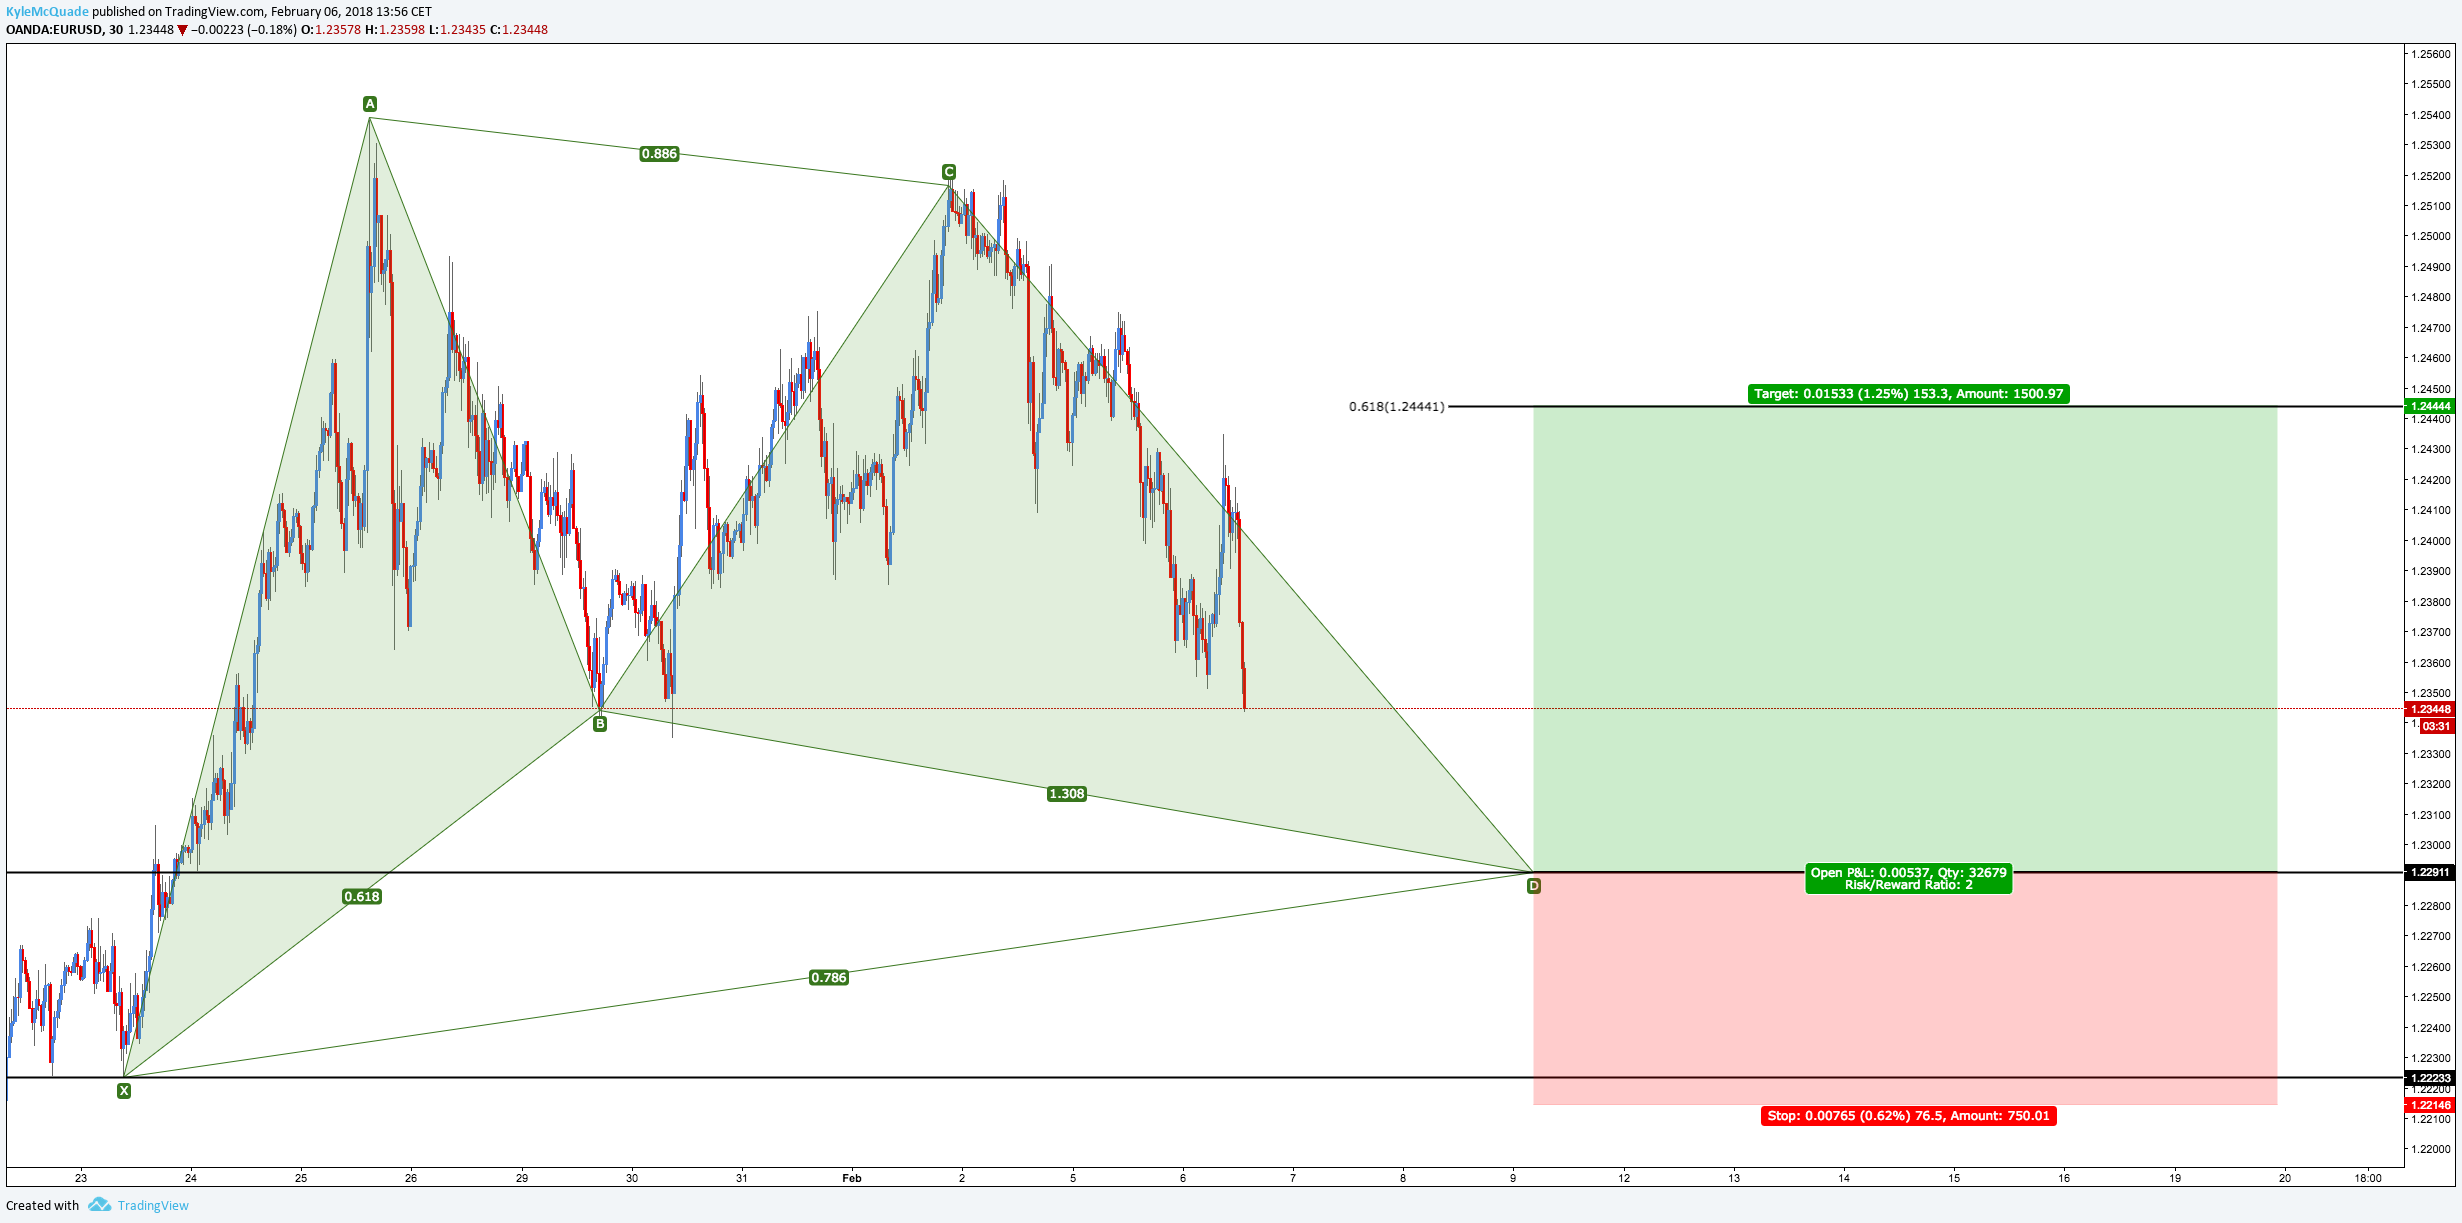
The measurements for a valid gartley pattern are detailed below.
B: 0.618
C: 0.382 - 0.886
D: 1.272 - 1.618
Final X to D: 0.786
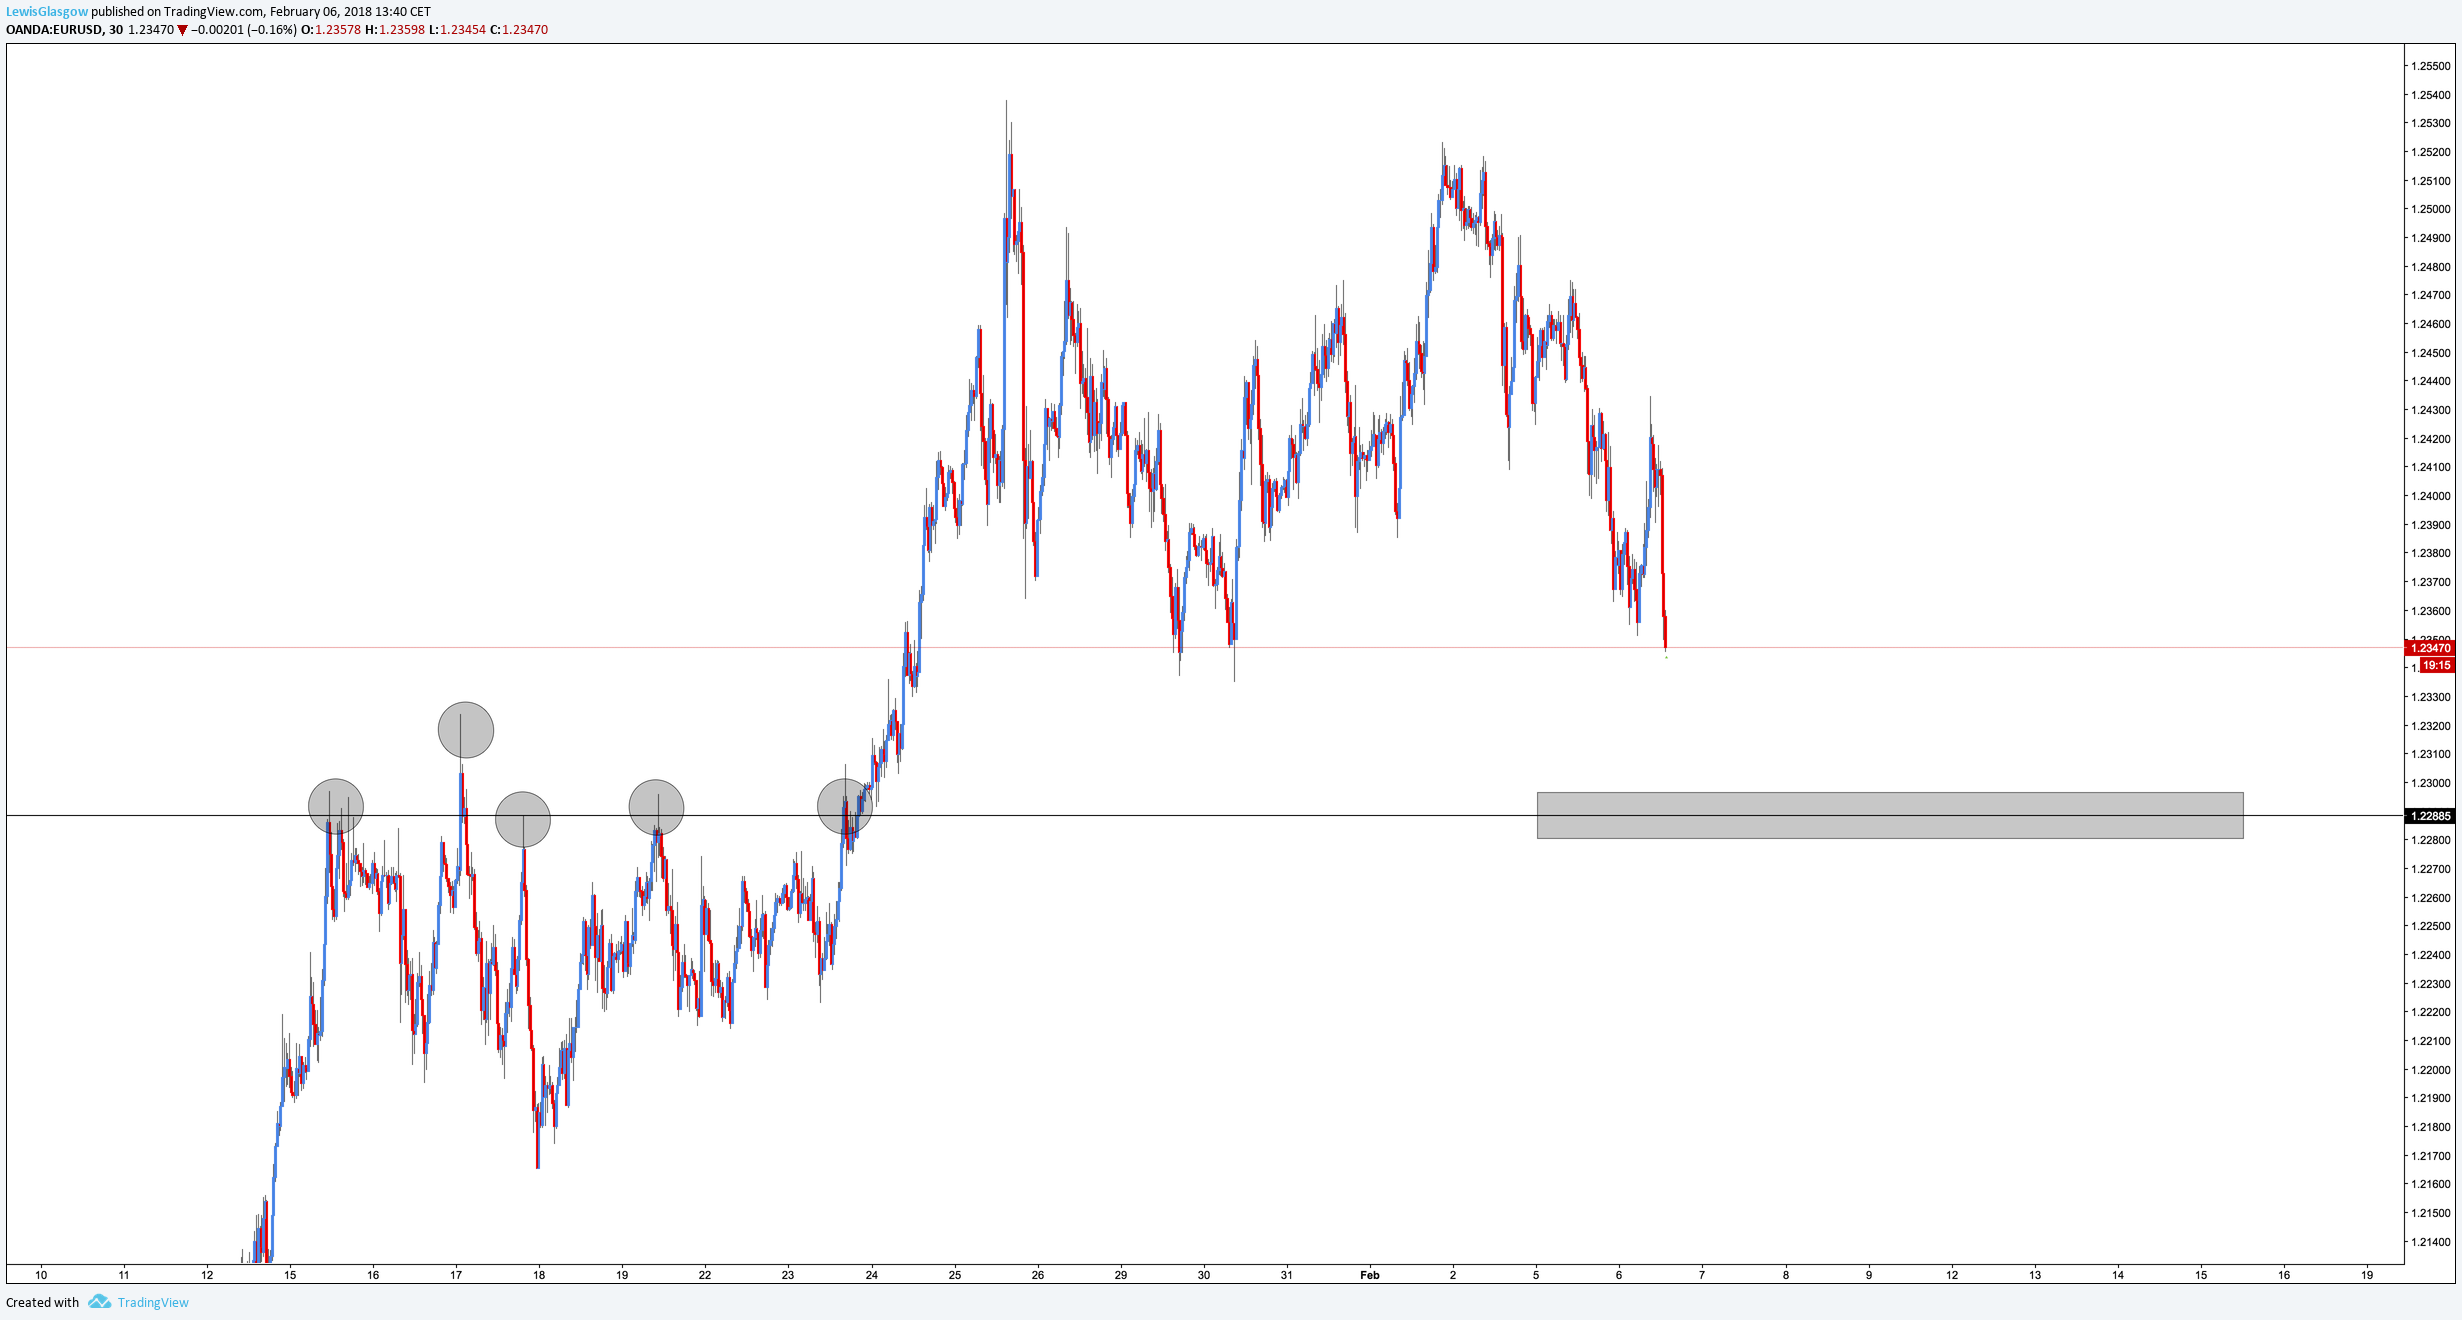
As you can see the PRZ forms on a critical level of support, this is an ideal area for a reversal to take place.
I'll re-analyse upon completion, this setup provides a 1:2 risk to reward.
Entry: 1.22911
SL: 1.22146
TP: 124444
Click here to view my original analysis on TradingView.
EUR/USD: Bullish Gartley
Following up from my previous successful bullish gartley for EUR/USD, we've now got another bullish gartley but this time on the 30m chart.
The measurements for a valid gartley pattern are detailed below.
B: 0.618
C: 0.382 - 0.886
D: 1.272 - 1.618
Final X to D: 0.786
As you can see the PRZ forms on a critical level of support, this is an ideal area for a reversal to take place.
I'll re-analyse upon completion, this setup provides a 1:2 risk to reward.
Entry: 1.22911
SL: 1.22146
TP: 124444
Click here to view my original analysis on TradingView.