My personal FX pairs and XAUUSD analysis

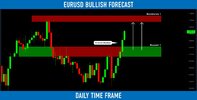
#EURUSD: Important Breakout

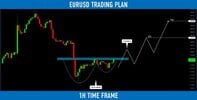
Bulls push EURUSD heavily after yesterday's Interest Rate Decision and FOMC.
The price has successfully broken and closed above a solid horizontal supply cluster.

The next solid resistance that I see is 1.099 - 1.103 area.
Probabilities will be high that it is the next goal for buyers.

For those, who missed entries, I strictly recommend waiting for a pullback first.
I will post an update later on.
For Additional confirmation use: Xmaster Formula MT4 Indicator
 

Attachments

  • eurusd.jpg
    eurusd.jpg
    60.1 KB · Views: 3
#GBPCAD: Pullback From Key Level

GBPCAD reached a major horizontal resistance.
The price has nicely reacted to that, forming a bearish engulfing candle on 4H time frame.

I expect a retracement from the underlined structure.
Goals: 1.68 / 1.677
 

Attachments

  • gbpcad.jpg
    gbpcad.jpg
    95.5 KB · Views: 2
Nasdaq-100 Index (#US100) Waiting For Breakout

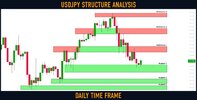
⚠️Nasdaq Index is stuck between 2 solid structures.
Depending on the reaction to the underlined areas, I see 2 potential scenarios.

1 - Bullish
If the price breaks and closes above 12700 - 12900 supply cluster on a daily,
I will expect a bullish movement at least to 13130

2 - Bearish
If the price drops and closes below 12300 - 12500 demand area on a daily,
I will expect a selloff to 11900

Wait for a breakout, it will show us the future direction of the market.
For Additional confirmation use: Breakout Indicator
 

Attachments

  • us30.jpg
    us30.jpg
    110.4 KB · Views: 2
#CHFJPY: Classic Bearish Setup

CHFJPY has nicely respected a confluence zone based on a horizontal 4H resistance and a 0.5 retracement of the last bearish impulse.

The price formed a double top pattern on that and broke its neckline.

Probabilities will be high that the pair will drop lower soon.
Goals: 141.172 / 140.363
 

Attachments

  • chfjpy.jpg
    chfjpy.jpg
    57.5 KB · Views: 2
Market Breakdown | WTI Oil, EURUSD, GBPNZD, EURAUD

Here are the updates & outlook for multiple instruments in my watchlist.

1️⃣ 
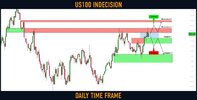
WTI Oil daily time frame️
The market is trading in a long term bearish trend .
After the last sharp bearish movement, the market is steadily recovering.

Ahead, I see a major horizontal supply area.
Probabilities are high, that the next bearish wave will initiate from there.

2️⃣ EURUSD daily time frame
After a breakout of a solid daily resistance, the market is preparing for its retest.
Watch carefully the underlined zone and look for buying opportunities from there.

3️⃣ EURAUD weekly time frame
The pair is currently approaching a weekly horizontal resistance cluster.
Taking into consideration, that the pair is quite overbought, probabilities will be high to see a pullback from that

4️⃣ GBPNZD daily time frame
The pair is currently retesting a broken neckline of an ascending triangle . As we discussed earlier, the trend line of a triangle and its neckline compose a contracting buy zone now.
Chances will be high that the next bullish wave will initiate quite soon.
For Additional confirmation use: Divergence Indicators
 

Attachments

  • market.jpg
    market.jpg
    116.1 KB · Views: 3
Gold (#XAUUSD): 2 Scenarios For This Week Explained

⚠️Gold closed this week, approaching a solid daily resistance.
Depending on the reaction of the price to that structure, I see 2 potential scenarios for next week.

Bullish Scenario
If the price breaks and closes above 2010 resistance on a daily,
a bullish continuation will be expected to 2060 level.

Bearish Scenario
The price may respect the underlined resistance.
1917 - 1940 is the closest strong support.
If the price drops and closes below that area,
a bearish continuation will be expected to 1891.

Wait for a breakout and then follow the market.
For Additional confirmation use: ROC Indicator
 

Attachments

  • gold.jpg
    gold.jpg
    59.1 KB · Views: 2
#USDJPY: Key Levels to Watch This Week

Here is my latest structure analysis for USDJPY.

Resistance 1: 132.46 - 133.25 area
Resistance 2: 135.0 - 135.8 area
Resistance 3: 137.36 - 137.9 area

Support 1: 129.64 - 130.7 area
Support 2: 128.09 - 128.7 area
Support 3: 127.2 - 127.8 area

Consider these structures for pullback/breakout trading.
 

Attachments

  • usdjpy.jpg
    usdjpy.jpg
    114.4 KB · Views: 2
#GBPNZD: Nice Bullish Clues

Update for GBPNZD.
It looks like the price has nicely respected a broken triangle.
The price formed a bullish engulfing candle on a daily.

Bullish bias on a pair remains.
Goal remains unchanged - 1.997
 

Attachments

  • gbpnzd.jpg
    gbpnzd.jpg
    102 KB · Views: 2
#EURUSD: Peculiar Pattern

I spotted a cup & handle pattern on ⚠️EURUSD on 1H time frame.
1.0777 - 1.0783 is its neckline.

If the price breaks and closes above that, I will expect a bullish movement.
Goals will be 1.0843 / 1.0894

If the price sets a new low, the pattern will become invalid.
 

Attachments

  • eurusd.jpg
    eurusd.jpg
    85.7 KB · Views: 2
Hey traders,

I spotted a classic harmonic ABCD pattern on ⚠️Natural Gas.
The completion point of the pattern matches perfectly with a horizontal key level.

Analyzing intraday time frames, I also spotted a falling wedge pattern on 12H.

To buy with a confirmation, wait for a bullish breakout of the resistance of the wedge.
Its violation may initiate a bullish movement.

The goals will be 2.43 / 2.58

Learn more about - chart patterns
 

Attachments

  • gas.jpg
    gas.jpg
    71.2 KB · Views: 2
Back
Top