My personal FX pairs and XAUUSD analysis

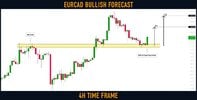
#EURCAD: One More Bullish Move Ahead

EURCAD is taking off from a solid horizontal structure support.
The price formed a bullish engulfing candle on a 4H time frame,
engulfing the range of the last 4 candles.

Chances will be high to see a movement up.
Goals: 1.485 / 1.4914
 

Attachments

  • eurcad.jpg
    eurcad.jpg
    87.6 KB · Views: 2
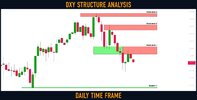
Dollar Index (#DXY): Key Levels to Watch This Week

Here is my latest structure for Dollar Index.

Resistance 1: 103.11 - 103.63 area
Resistance 2: 104.74 - 105.1 area
Resistance 3: 105.667 - 105.88 area

Support 1: 100.82 - 100.88 area

Consider these structures for pullback/breakout trading.
For Additional confirmation use: Swing Trading Indicators
 

Attachments

  • dxy.jpg
    dxy.jpg
    89.4 KB · Views: 1
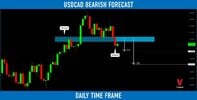
#USDCAD: Important Breakout

USDCAD broke and closed below a solid horizontal demand cluster on a daily.
The broken structure turned into resistance now.

Probabilities will be high to see a bearish move from that.
Goals will be 1.356 / 1.346
For Additional confirmation use: the best mt4 indicators
 

Attachments

  • usdcad.jpg
    usdcad.jpg
    55.3 KB · Views: 1
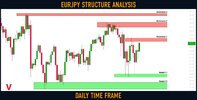
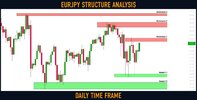
#EURJPY: Detailed Structure Analysis

Here are my latest structure analysis for ⚠️EURJPY.

Support 1: 138.80 - 139.25 area
Support 2: 137.38 - 138.18 area

Resistance 1: 143.19 - 143.6 area
Resistance 2: 145.00 - 145.58 area
Resistance 3: 146.40 - 146.7 area

Consider these structures for pullback/breakout trading.
 

Attachments

  • eurjpy.jpg
    eurjpy.jpg
    75.8 KB · Views: 1
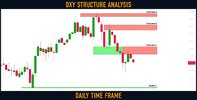
Dollar Index (#DXY): Key Levels to Watch This Week

Here is my latest structure for Dollar Index.

Resistance 1: 103.11 - 103.63 area
Resistance 2: 104.74 - 105.1 area
Resistance 3: 105.667 - 105.88 area

Support 1: 100.82 - 100.88 area

Consider these structures for pullback/breakout trading.
 

Attachments

  • dxy.jpg
    dxy.jpg
    89.3 KB · Views: 2
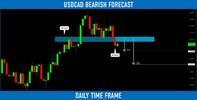
#USDCAD: Important Breakout

USDCAD broke and closed below a solid horizontal demand cluster on a daily.
The broken structure turned into resistance now.

Probabilities will be high to see a bearish move from that.
The goals will be 1.356 / 1.346
For Additional confirmation use: the SAR Parabolic Indicator
 

Attachments

  • usdcad.jpg
    usdcad.jpg
    86.3 KB · Views: 1
#EURJPY: Detailed Structure Analysis

Here are my latest structure analysis for ⚠️EURJPY.

Support 1: 138.80 - 139.25 area
Support 2: 137.38 - 138.18 area

Resistance 1: 143.19 - 143.6 area
Resistance 2: 145.00 - 145.58 area
Resistance 3: 146.40 - 146.7 area

Consider these structures for pullback/breakout trading.
 

Attachments

  • eurjpy.jpg
    eurjpy.jpg
    117.6 KB · Views: 1
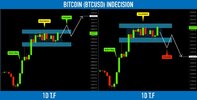
BITCOIN (#BTCUSD): Waiting For The Next Move ₿

⚠️Bitcoin is consolidating after a sharp bullish rally.
The price is coiling within a horizontal trading range on a daily.

Depending on the reaction of the price to its boundaries, I see 2 potential scenarios.

Bullish
If the price breaks and closes above 28950 on a daily,
I will expect a bullish trend continuation.
Target will be 31000.

Bearish
If the price drops and closes below 26300 on a daily,
a bearish move will be expected.
Goal will be 24300.

Because the trend is bullish, I am on a bulls' side as well.
However, let's see what will happen.
 

Attachments

  • btc.jpg
    btc.jpg
    59.4 KB · Views: 1
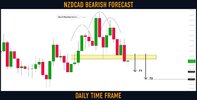
#NZDCAD: Classic Bearish Pattern

NZDCAD formed a head & shoulders pattern on a daily time frame.
Its neckline was successfully broken yesterday.

I expect a further decline on the pair.
Targets: 0.84 / 0.837
 

Attachments

  • nzdcad.jpg
    nzdcad.jpg
    92.4 KB · Views: 2
MarketBreakdown | GOLD, USDJPY, SILVER, US30

Here are the updates & outlook for multiple instruments in my watchlist.

1️⃣ Gold (#XAUUSD) 4h time frame
Gold is perfectly respecting a minor rising trend line .
So far, I would expect a bullish continuation from that.
Goal for buyers might be the underlined yellow resistance.

If you are looking for shorting, consider a bearish breakout of the trend line .
I can give you a perfect confirmation to sell.

2️⃣ #USDJPY daily time frame
The market is approaching a solid horizontal resistance.
Taking into consideration that the pair is quite overbought and trading in a bearish trend ,
I believe that probabilities will be high to see a bearish move from that.

3️⃣ Silver (#XAGUSD) 4h time frame
I spotted a cute bullish accumulation pattern - an ascending triangle formation.
The price has successfully violated its neckline.
It looks like the market will keep growing.

4️⃣ Dow Jones (#US30) daily time frame
The market is approaching a solid daily resistance.
We see its breakout attempt now.
If a daily candle closes above that, the Index may go much higher.
For Additional confirmation use: the Best Scalping Indicators
 

Attachments

  • market.jpg
    market.jpg
    105.5 KB · Views: 0
Back
Top