My personal FX pairs and XAUUSD analysis

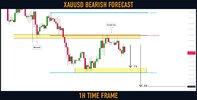
Gold (#XAUUSD): Time To Sell

Gold is retesting a recently broken structure.
The price has nicely respected a confluence point based on the underlined resistance and 618 retracement of the last bearish impulse.

As the extra confirmation, the price formed a double top pattern.

I expect a bearish move to 1808 / 1801
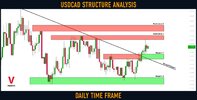
 

Attachments

  • gold.jpg
    gold.jpg
    96.3 KB · Views: 3
#USDCAD: Key Levels to Watch This Week

Here is my latest structure analysis for ⚠️USDCAD.

Resistance 1: 1.366 - 1.3707 area
Resistance 2: 1.3745 - 1.381 area

Support 1: 1.347 - 1.352 area
Support 2: 1.3225 - 1.329 area

Vertical Support 1: major falling trend line .

Consider these structures for pullback or breakout trading strategy.
 

Attachments

  • usdcad.jpg
    usdcad.jpg
    81.8 KB · Views: 3
#EURCAD: Detailed Technical Outlook

Here is the wave analysis for ⚠️EURCAD.

The market is currently consolidating with a horizontal trading range on a weekly, after a strong bullish impulse.
1.46 - 1.465 is the resistance of the range,
1.423 - 1.43 is its support.

The upper boundary of the range matches perfectly with a key weekly resistance.

Depending on the reaction of the price to the boundaries of the range, I see 2 potential scenarios:
If the price breaks and closes above the resistance of the range, one more bullish wave will be expected.
While, a bearish breakout of the support of the range will most likely initiate a correctional movement.

Wait for a breakout and then follow the market.
 

Attachments

  • eurcad.jpg
    eurcad.jpg
    107.5 KB · Views: 3
#GBPJPY: Classic Trend Following

GBPJPY remains very bullish from the beginning of the year.
After the last impulsive movement, the market retraced to a peculiar confluence zone.
I see a perfect match between 0.5 retracement of the last bullish leg and a horizontal structure support.

I will expect a pullback from that to 165.0 / 165.7
vwap mt4 indicator
 

Attachments

  • gbpjpy.jpg
    gbpjpy.jpg
    93 KB · Views: 2
#USDCHF: Detailed Structure Analysis

Here is my latest structure analysis for ⚠️USDCHF.

Support 1: 0.928 - 0.933 area
Support 2: 0.922 - 0.923 area
Support 3: 0.9137 - 0.916 area

Resistance 1: 0.942 - 0.946 area
Resistance 2: 0.954 - 0.955 area

Consider these structure for pullback/breakout trading.
 

Attachments

  • usdchf.jpg
    usdchf.jpg
    111.5 KB · Views: 1
Dow Jones Index (#US30): Oversold Market & Pullback

Dow Jones Index reached a key level.
Testing that, the price formed an inverted head & shoulders pattern on an hourly time frame
and broke a resistance line of a falling wedge pattern then.

I expect a pullback now.
Goals: 32950 / 33110
 

Attachments

  • us30.jpg
    us30.jpg
    113.8 KB · Views: 2
Crude Oil (#WTI): Bearish Outlook Explained

Crude Oil is coiling on a key horizontal resistance.
The price formed a double top pattern, testing that
and broke its neckline then.

We may see a retracement from the underlined blue zone.
Goals: 76.9 / 76.36
 

Attachments

  • oil.jpg
    oil.jpg
    92.7 KB · Views: 2
#EURCAD: Important Breakout

EURCAD broke and closed above a major horizontal supply cluster with a high momentum bullish candle yesterday.
1.441 - 1.446 is now turned into a demand zone.

I will expect a bullish wave from that area to 1.455 / 1.46 levels.
 

Attachments

  • eurcad.jpg
    eurcad.jpg
    59.8 KB · Views: 2
#CADCHF: Bearish Move From Key Level

It looks like CADCHF may drop.
The price reached a solid horizontal resistance and formed a tiny double top pattern on an hourly time frame. Now we see a strong bearish pressure.

I expect a bearish continuation to 0.6913 / 0.6905
 

Attachments

  • cadchf.jpg
    cadchf.jpg
    85.4 KB · Views: 2
#GBPCAD: Your Trading Plan For Today

⚠️GBPCAD is coiling on a key level.
I see a horizontal trading range on 1H time frame.

1.6263 - 1.6274 is its neckline.
Wait for its bullish breakout (hourly candle close above).
It will be your confirmation to buy.

Open long aggressively or on a retest then.
Goals will be 1.6307 / 1.633

If the price sets a new lower low, the setup will become invalid.
 

Attachments

  • gbpcad.jpg
    gbpcad.jpg
    105.2 KB · Views: 2
Back
Top