My personal FX pairs and XAUUSD analysis

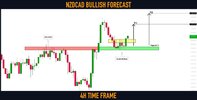
#NZDCAD: Bullish Outlook Explained

NZDCAD is taking off from a key horizontal support.
The price formed a double bottom on that and broke its neckline then.

I expect a bullish continuation to 0.851 / 0.854
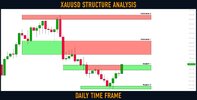
 

Attachments

  • nzdcad.jpg
    nzdcad.jpg
    89.6 KB · Views: 2
Gold (#XAUUSD): Key Levels to Watch This Week

Here is my latest structure analysis for ⚠️Gold.

Support 1: 1843 - 1853 area
Support 2: 1804 - 1811 area

Resistance 1: 1875 - 1904 area
Resistance 2: 1950 - 1959 area

Consider these structures for pullback/breakout trading next week.
Best MT4 Indicators
 

Attachments

  • gold.jpg
    gold.jpg
    60.4 KB · Views: 3
#AUDNZD: Bearish Outlook Explained

AUDNZD is testing a wide daily horizontal supply area.
The price formed a double top pattern, approaching that on an hourly time frame
and broke its neckline with a high momentum bearish candle.

I expect a retracement to 1.0848 / 1.0828
 

Attachments

  • audnzd.jpg
    audnzd.jpg
    102.5 KB · Views: 2
S&P500 Index (#SPY): Time to Sell

S&P500 Index is testing a wide daily horizontal resistance cluster.
Probabilities will be high to see a bearish reaction from that.

I believe that the market may drop today to 4032 / 4021 levels.
MACD Indicator
 

Attachments

  • spy.jpg
    spy.jpg
    98.3 KB · Views: 2
BITCOIN (#BTCUSD): Detailed Technical Outlook ₿

⚠️Bitcoin successfully violated a wide horizontal daily demand area.
The broken structure turned into a supply zone.

The market is correcting now.
I spotted a bearish flag pattern on 4H time frame.
Its bearish breakout may initiate the next sell off.
Watch carefully the reaction of the price to its rising support.
Consider shorting after a 4H candle close below with initial target being 22100.
 

Attachments

  • bitcoin.jpg
    bitcoin.jpg
    66.3 KB · Views: 2
Gold (#XAUUSD): Time For Pullback

Gold is approaching a wide horizontal demand cluster on 4H.
Taking into consideration, that the market is trading in a minor bullish trend,
probabilities will be high to see a pullback from the underlined area.

I expect growth to 1855 / 1862
Best Gold Trading Robot - Scouts Gold V9 Robot
 

Attachments

  • gold.jpg
    gold.jpg
    92 KB · Views: 2
Crude Oil (#WTI): Bearish Outlook Explained

WTI Crude Oil reached a key daily structure resistance.
The price formed a tiny little double top on that on 1H time frame.
Its neckline has been just broken.

The market will most likely keep retracing.
Goals: 79.9 / 79.6
Best Scalping Indicators
 

Attachments

  • oil.jpg
    oil.jpg
    64.2 KB · Views: 2
Dow Jones Index (#US30): Key Levels to Watch This Week

Here is my latest structure analysis for US30 Index.

Support 1: 32470 - 32650 area
Support 2: 31700 - 31975 area

Resistance 1: 33475 - 33660 area
Resistance 2: 34300 - 34500 area
Resistance 3: 34820 - 34900 area

Vertical Resistance 1: major rising trend line .

Currently, the market is approaching a confluence zone based on Vertical & Horizontal Resistance 1.
Probabilities will be high to see a pullback from there.

Consider the underlined structures for pullback/breakout trading.
 

Attachments

  • us30.jpg
    us30.jpg
    115.5 KB · Views: 2
#AUDCAD: Time to Grow

AUDCAD dropped to a key daily structure support.
The price formed a double bottom pattern, testing that on 1H,
its neckline was broken then.

I expect a bullish move to 0.91 / 0.9117
 

Attachments

  • audcad.jpg
    audcad.jpg
    102 KB · Views: 2
Back
Top