NPBFX - making money with us since 1996!

Tesla Inc.: technical analysis 12.05.2023

Good afternoon, dear forum visitors!

NPBFX offers the latest release of analytics on Tesla Inc. for a better understanding of the current market situation and more efficient trading.

Shares of Tesla Inc., the world’s leading manufacturer of electric cars, are trading at 172.00.

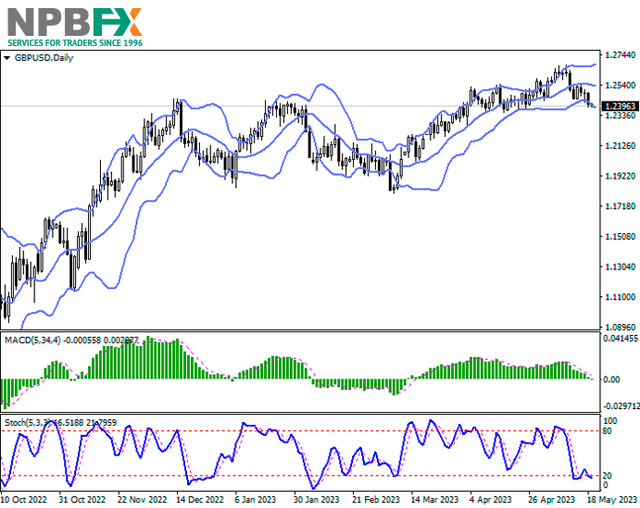
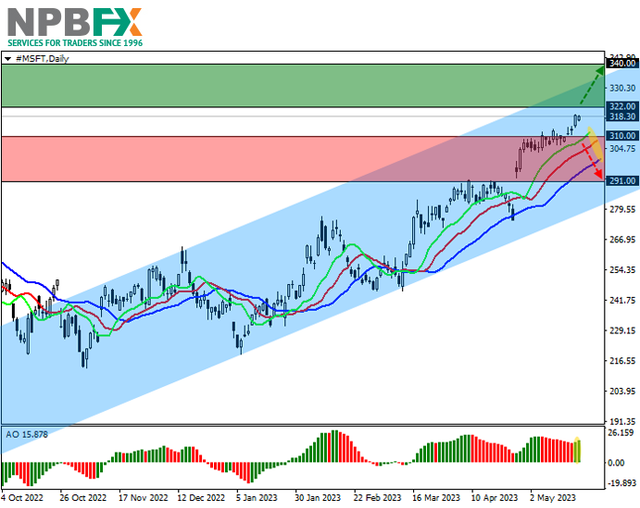
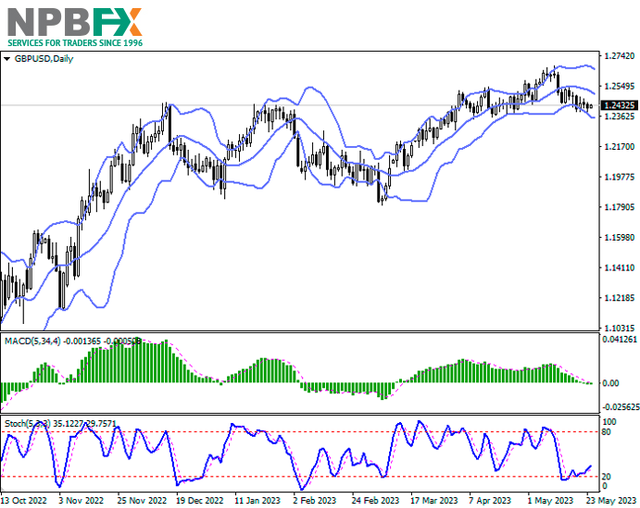
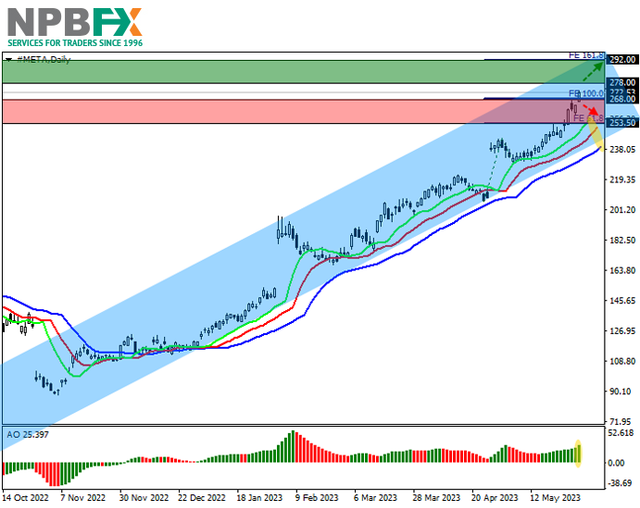
On the daily chart, the price is correcting within the global downward corridor with dynamic boundaries of 190.00–145.00, forming an upward wave.

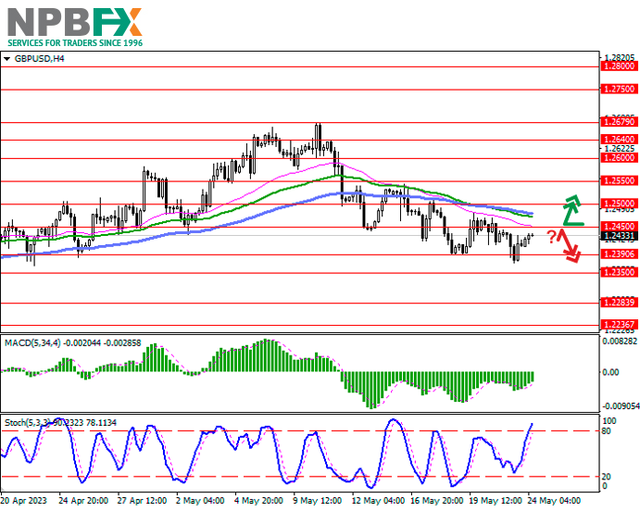
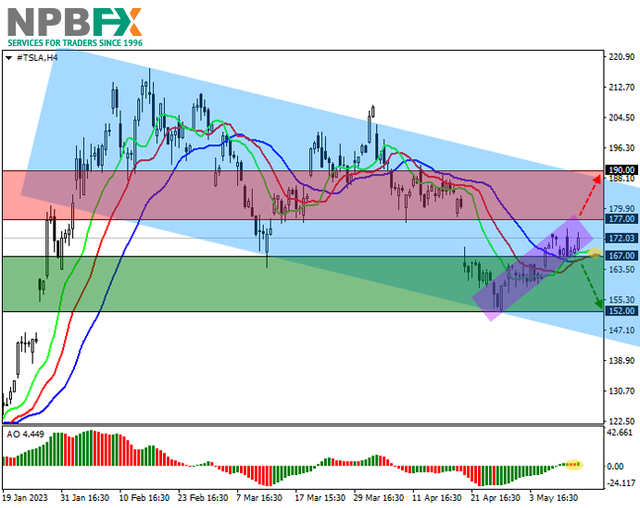
On a four-hour chart, the wave is developing as a local corridor with dynamic boundaries of 177.00–167.00, which can work as a Flag pattern, which will mean a continuation of the decline to the low of 152.00. Further dynamics of quotes will be determined by the direction of their exit from the local channel.

Technical indicators remain neutral: fast EMAs on the Alligator indicator are close to the signal line, and the AO histogram stays in the buy zone near the transition level.

TSLA-120523-11.png


Trading tips

Short positions may be opened after the price drops and consolidates below 167.00 with the target at 152.00. Stop loss – 172.00. Implementation period: 7 days or more.

Long positions may be opened after a reversal, growth, and consolidation of the price above 177.00 with the target at 190.00. Stop loss – 172.00.

Use more opportunities of the NPBFX analytical portal: weekly FOREX forecast

You can learn more about the current situation and get acquainted with the weekly analytical forecast in the "Video reviews" section on the NPBFX portal. Weekly video reviews contain trends, key levels, trading recommendations for such popular instruments as GBP/USD, EUR/USD, USD/CHF, AUD/USD. In order to get free and unlimited access to video forecast and other useful instruments on the portal, you need to register on the NPBFX website.

If you have any questions about trading instruments, you can always ask an analyst in the online chat on the portal and get a free consultation of an experienced specialist.

Use the current recommendations of analysts on Tesla Inc. and trade efficiently with NPBFX.
 
Walmart Inc.: technical analysis 15.05.2023

Good afternoon, dear forum visitors!

NPBFX offers the latest release of analytics on Walmart Inc. for a better understanding of the current market situation and more efficient trading.

Shares of Walmart Inc., the US company that operates the world’s largest wholesale and retail chain, are at 153.00.

On the daily chart, the price is correcting within the global ascending corridor with dynamic boundaries of 165.00–140.00.

On the four-hour chart, within the growth wave, a local Head and shoulders reversal pattern is formed with the Neckline at 150.00. If the formation is realized, the quotes will reach 145.00, after which the global uptrend will continue.

Technical indicators support the upward scenario but do not rule out a local correction: fast EMAs on the Alligator indicator began to narrow the fluctuation range, approaching the signal line, and the AO histogram is forming corrective bars.

WMT-150523-11.png


Trading tips

Short positions may be opened after a reversal, reduction, and consolidation of the price below 151.00 with the target at 146.00. Stop loss – 153.00. Implementation period: 7 days or more.

Long positions may be opened after the price rises and consolidates above 154.50 with the target at 159.00. Stop loss – 152.00.

Use more opportunities of the NPBFX analytical portal: analytics

You can find more actual analytical reviews on other popular currency pairs, metals and CFDs on the NPBFX online portal. Daily analytics with charts, current market prognoses and trading scenarios in the Feed section are available. Get free and unlimited access to the online portal after registering on the official website of NPBFX Company.

If you have any questions about trading instruments, you can always ask an analyst in the online chat on the portal and get a free consultation of an experienced specialist.

Use the current recommendations of analysts on Walmart Inc. and trade efficiently with NPBFX.
 
EUR/USD: mixed trading dynamics in anticipation of new drivers 17.05.2023

Good afternoon, dear forum visitors!

NPBFX offers the latest release of analytics on EUR/USD for a better understanding of the current market situation and more efficient trading.

Current trend

The EUR/USD pair shows mixed trading dynamics, consolidating near 1.0865 and local lows updated at the beginning of the week. Investor activity remains low, despite the fact that quite a lot of macroeconomic statistics comes to the market.

Published on Tuesday, May 16, data from Europe managed to provide only short-term support for the single currency, after which, with the opening of the American session, the dollar managed to win back the lost positions. Anyway, the Employment Rate in the euro area in the first quarter added 0.6% after rising by 0.3% in the previous month with a neutral forecast and accelerated from 1.5% to 1.7% in annual terms, while analysts expected deceleration to 0.4%. Updated statistics on the dynamics of the Gross Domestic Product (GDP) of the eurozone for the first quarter reflected economic growth at previous levels of 0.1% in quarterly terms and 1.3% in annual terms. However, the May index of Economic Sentiment from the Center for European Economic Research (ZEW) for the countries of the region as a whole fell from 6.4 points to -9.4 points instead of the expected -1.0 points, and for Germany it fell from 4.1 points to -10.7 points with preliminary estimates of -5.3 points. The index of Current Situation in Germany fell from -32.5 points to -34.8 points, while the market expected -37.5 points. These data indicate a possible worsening of the economic situation in the EU in the second half of the year and reinforce fears of a recession.

Support and resistance

Bollinger Bands in D1 chart demonstrate a moderate decrease. The price range expands from below, making way for new local lows for the "bears". MACD is going down preserving a stable sell signal (located below the signal line). Stochastic, which has reached its lows, is reversing upwards, signaling in favor of the development of corrective growth in the near future.

Resistance levels: 1.0900, 1.0957, 1.1000, 1.1051.
Support levels: 1.0850, 1.0800, 1.0758, 1.0700.

EURUSD170523-33.png


EURUSD170523-333.png


Trading tips

Short positions may be opened after a breakdown of 1.0850 with the target at 1.0758. Stop-loss — 1.0900. Implementation time: 1-2 days.

A rebound from 1.0850 as from support followed by a breakout of 1.0900 may become a signal for opening new long positions with the target at 1.1000. Stop-loss — 1.0850.

Use more opportunities of the NPBFX analytical portal: analytics

You can find more actual analytical reviews on other popular currency pairs, metals and CFDs on the NPBFX online portal. Daily analytics with charts, current market prognoses and trading scenarios in the Feed section are available. Get free and unlimited access to the online portal after registering on the official website of NPBFX Company.

If you have any questions about trading instruments, you can always ask an analyst in the online chat on the portal and get a free consultation of an experienced specialist.

Use the current recommendations of analysts on EUR/USD and trade efficiently with NPBFX.
 
GBP/USD: pound develops "bearish" dynamics at the end of the week 19.05.2023

Good afternoon, dear forum visitors!

NPBFX offers the latest release of analytics on GBP/USD for a better understanding of the current market situation and more efficient trading.

Current trend

The GBP/USD pair is trading with downward dynamics, developing a strong "bearish" momentum formed the day before. The instrument is testing the level of 1.2390 for a breakdown, updating local lows from April 25.

Macroeconomic publications, as well as the prospects for a positive decision on the issue of adjusting the US government debt limit, contributed to an active decrease in the instrument the day before. President Joe Biden, who is currently in Japan for the G7 summit, assured the world community that the government will not allow a default, since all congressmen are aware of its catastrophic consequences not only for the American economy, but for the world. The head of the White House will interrupt his trip to return to the United States on Sunday and continue working to achieve a final consensus between Republicans and Democrats.

Among macroeconomic publications, investors drew attention to the decrease in the number of Initial Jobless Claims for the week ended May 12 from 264.0 thousand to 242.0 thousand, which turned out to be 10.0 thousand better than analysts' expectations, and the number of Continuing Jobless Claims for the week ended May 5 fell from 1.807 million to 1.799 million, while analysts had expected growth to 1.818 million.

The data from the UK released today did not provide any support to the pound. GfK Consumer Confidence in May rose from -30.0 points to -27.0 points, which fully coincided with analysts' forecasts.

Support and resistance

Bollinger Bands in D1 chart demonstrate flat dynamics. The price range expands from below, making way for new local lows for the "bears". MACD is going down preserving a stable sell signal (located below the signal line). The indicator is trying to consolidate below the zero level. Stochastic shows similar dynamics; however, the indicator line is close to its lows, indicating the risks of the pound being oversold in the near future.

Resistance levels: 1.2450, 1.2500, 1.2550, 1.2600.
Support levels: 1.2390, 1.2350, 1.2283, 1.2236.

GBPUSD190523-33.png


GBPUSD190523-333.png


Trading tips

Short positions may be opened after a breakdown of 1.2390 with the target at 1.2283. Stop-loss — 1.2450. Implementation time: 2-3 days.

A rebound from 1.2390 as from support followed by a breakout of 1.2450 may become a signal for opening new long positions with the target at 1.2550. Stop-loss — 1.2390.

Use more opportunities of the NPBFX analytical portal: weekly FOREX forecast

You can learn more about the current situation and get acquainted with the weekly analytical forecast in the "Video reviews" section on the NPBFX portal. Weekly video reviews contain trends, key levels, trading recommendations for such popular instruments as GBP/USD, EUR/USD, USD/CHF, AUD/USD. In order to get free and unlimited access to video forecast and other useful instruments on the portal, you need to register on the NPBFX website.

If you have any questions about trading instruments, you can always ask an analyst in the online chat on the portal and get a free consultation of an experienced specialist.

Use the current recommendations of analysts on GBP/USD and trade efficiently with NPBFX.
 
Microsoft Corp.: technical analysis 22.05.2023

Good afternoon, dear forum visitors!

NPBFX offers the latest release of analytics on Microsoft Corp. for a better understanding of the current market situation and more efficient trading.

Shares of Microsoft Corp., a global giant in the development and sale of operating systems and software for computers, are trading at 318.00.

On the daily chart, the price is moving within an uptrend and is approaching the resistance line of the ascending corridor with dynamic boundaries of 280.00–338.00.

On the four-hour chart, the prospects for continued growth have noticeably increased after renewing the local high of 310.00, and the global channel resistance line around 340.00 is now the main target. The positions of the “bears” have noticeably weakened, and to start the decline, the price needs to consolidate below the previous resistance of 300.00.

Technical indicators support the upward scenario: the range of EMA fluctuations on the Alligator indicator is expanding upwards, and the AO histogram is forming rising bars, growing in the buying zone.

MSFT-220523-22.png


Trading tips

Long positions may be opened after the price rises and consolidates above 322.00 with the target at 340.00. Stop loss — 315.00. Implementation period: 7 days or more.

Short positions may be opened after a reversal, reduction, and consolidation of the price below 310.00 with the target at 291.00. Stop loss — 315.00.

Use more opportunities of the NPBFX analytical portal: E-book

If you just recently started to be interested in trading on FOREX and would like to deepen your knowledge, an electronic Beginner's Guide to FOREX Trading will be an excellent helper for you here. The book consists of 5 chapters and reflects fundamental concepts of the foreign exchange market to start successful trading. From the main chapters of the E-book you can learn about the concepts and history of FOREX, currencies and trend lines, technical indicators, types of orders, trading on news, psychology of trading, risk management and much more.

You can read a Beginner's guide to FOREX Trading online or download it free of charge from the NPBFX analytical portal in the "Education" section. In order to get unlimited access to the E-book and other useful instruments on the portal, you need to register on the NPBFX website.

If you have any questions about trading instruments, you can always ask an analyst in the online chat on the portal and get a free consultation of an experienced specialist.

Use the current recommendations of analysts on Microsoft Corp. and trade efficiently with NPBFX.
 
GBP/USD: in April, the UK public debt reached 99.2% of the country's GDP 24.05.2023

Good afternoon, dear forum visitors!

NPBFX offers the latest release of analytics on GBP/USD for a better understanding of the current market situation and more efficient trading.

Current trend

The GBP/USD pair is trading with a weak upward trend around 1.2443, recovering after a two-day correction, as a result of which local lows from April 21 were updated.

The reason for the strengthening of the trading instrument is mainly technical factors, while the macroeconomic background does not provide significant support to the British currency. The data from Great Britain, published the day before, had additional slight pressure on the positions of the pound. S&P Global/CIPS Manufacturing PMI in May fell from 47.8 points to 46.9 points, while forecasts suggested its growth to 48.0 points, and Services PMI fell from 55.9 points to 55.1 points, which turned out to be worse than the expected 55.5 points. Today, market participants are evaluating the inflation statistics for April: the annual Consumer Price Index slowed down from 10.1% to 8.7%, which turned out to be worse than forecasts at 8.3%, while in monthly terms the indicator accelerated from 0.8% to 1.2%, while analysts did not expect changes, and the Core CPI corrected from 6.2% to 6.8% in annual terms. In turn, the Retail Price Index rose to 1.5% in April from 0.7% earlier, and in annual terms it slowed down from 13.5% to 11.4%, while analysts expected 1.2% and 11.1%, respectively. During the day, investors will follow the speech of the Governor of the Bank of England, Andrew Bailey, who may clarify the regulator's plans for further tightening of monetary policy.

Meanwhile, the UK Office for National Statistics (ONS) recorded a record level of public debt in April, which amounted to 2.54 trillion pounds or 99.2% of the country's Gross Domestic Product (GDP). Last month, public sector net borrowing, excluding state banks, was 25.6 billion pounds, well above the previous year's figure of 11.9 billion pounds and analysts' forecast of 19.75 billion pounds. Chancellor of the Exchequer Jeremy Hunt said the government will begin to reduce debt, but acknowledged that the additional funds have helped support households and businesses in the wake of the pandemic and amid the energy crisis.

Support and resistance

Bollinger Bands in D1 chart demonstrate a moderate decrease. The price range is narrowing, reflecting the emergence of ambiguous dynamics of trading in the short term. MACD is declining keeping a weak sell signal (located below the signal line) The indicator is trying to consolidate below the zero level. Stochastic, on the contrary, demonstrates moderate growth, signaling in favor of the development of corrective dynamics in the near future.

Resistance levels: 1.2450, 1.2500, 1.2550, 1.2600.
Support levels: 1.2390, 1.2350, 1.2283, 1.2236.

GBPUSD240523-33.png


GBPUSD240523-333.png


Trading tips

Long positions can be opened after a breakout of 1.2450 with the target of 1.2550. Stop-loss — 1.2390. Implementation time: 2-3 days.

A rebound from 1.2450 as from resistance, followed by a breakdown of 1.2390 may become a signal for opening of new short positions with the target at 1.2283. Stop-loss — 1.2450.

Use more opportunities of the NPBFX analytical portal: weekly FOREX forecast

You can learn more about the current situation and get acquainted with the weekly analytical forecast in the "Video reviews" section on the NPBFX portal. Weekly video reviews contain trends, key levels, trading recommendations for such popular instruments as GBP/USD, EUR/USD, USD/CHF, AUD/USD. In order to get free and unlimited access to video forecast and other useful instruments on the portal, you need to register on the NPBFX website.

If you have any questions about trading instruments, you can always ask an analyst in the online chat on the portal and get a free consultation of an experienced specialist.

Use the current recommendations of analysts on GBP/USD and trade efficiently with NPBFX.
 
The Walt Disney Co.: technical analysis 26.05.2023

Good afternoon, dear forum visitors!

NPBFX offers the latest release of analytics on The Walt Disney Co. for a better understanding of the current market situation and more efficient trading.

Shares of The Walt Disney Co., one of the leaders in the global entertainment industry, are moving within a corrective trend at 88.00.

On the daily chart, the price is trading within the global sideway with the boundaries of 78.00–116.00, forming a downward wave.

On the four-hour chart, the local ascending channel with the boundaries of 99.00–107.00 was interrupted, and the quotes broke the support line with a price gap of 101.00–95.00, continuing to move to the December low of 85.00. In case of consolidation below it, there will be practically no obstacles on the way to the support line of 78.00.

Technical indicators keep a stable sell signal: fast EMAs on the Alligator indicator are moving away from the signal line, and the AO histogram is forming downward bars, falling in the sell zone.

DIS260523-22.png


Trading tips

Short positions may be opened after the price drops and consolidates below 85.00 with the target at 78.00. Stop loss — 90.00. Implementation period: 7 days or more.

Long positions may be opened after a reversal, growth, and consolidation of the price above 91.50 with the target at 101.00. Stop loss — 90.00.

Use more opportunities of the NPBFX analytical portal: E-book

If you just recently started to be interested in trading on FOREX and would like to deepen your knowledge, an electronic Beginner's Guide to FOREX Trading will be an excellent helper for you here. The book consists of 5 chapters and reflects fundamental concepts of the foreign exchange market to start successful trading. From the main chapters of the E-book you can learn about the concepts and history of FOREX, currencies and trend lines, technical indicators, types of orders, trading on news, psychology of trading, risk management and much more.

You can read a Beginner's guide to FOREX Trading online or download it free of charge from the NPBFX analytical portal in the "Education" section. In order to get unlimited access to the E-book and other useful instruments on the portal, you need to register on the NPBFX website.

If you have any questions about trading instruments, you can always ask an analyst in the online chat on the portal and get a free consultation of an experienced specialist.

Use the current recommendations of analysts on The Walt Disney Co. and trade efficiently with NPBFX.
 
Netflix Inc.: technical analysis 29.05.2023

Good afternoon, dear forum visitors!

NPBFX offers the latest release of analytics on Netflix Inc. for a better understanding of the current market situation and more efficient trading.

Shares of Netflix Inc., an American entertainment company and movie and TV series streaming service, are trading at 378.00.

On the daily chart, the price is correcting within the global ascending corridor with dynamic boundaries of 330.00–440.00, forming another wave of growth.

On the four-hour chart, the upside potential remains high as the quotes consolidated above the yearly high of 376.00. The local Three Crows candlestick pattern with the base target above 400.00, which is implementing, also confirms the positive dynamics.

Technical indicators keep a stable buy signal: fast EMAs on the Alligator indicator are moving away from the signal line, and the AO histogram is forming rising bars in the buying zone.

NFLX-290523-22.png


Trading tips

Long positions may be opened after the price rises and consolidates above 385.00 with the target at 420.00. Stop loss – 365.00. Implementation period: 7 days or more.

Short positions may be opened after a reversal, reduction, and consolidation of the price below 368.00 with the target at 330.00. Stop loss – 380.00.

Use more opportunities of the NPBFX analytical portal: analytics

You can find more actual analytical reviews on other popular currency pairs, metals and CFDs on the NPBFX online portal. Daily analytics with charts, current market prognoses and trading scenarios in the Feed section are available. Get free and unlimited access to the online portal after registering on the official website of NPBFX Company.

If you have any questions about trading instruments, you can always ask an analyst in the online chat on the portal and get a free consultation of an experienced specialist.

Use the current recommendations of analysts on Netflix Inc. and trade efficiently with NPBFX.
 
GBP/USD: the pound is being corrected after a strong growth the day before 31.05.2023

Good afternoon, dear forum visitors!

NPBFX offers the latest release of analytics on GBP/USD for a better understanding of the current market situation and more efficient trading.

Current trend

The GBP/USD pair is trading around 1.2390, correcting after a rather active growth the day before, which allowed the instrument to renew local highs from May 24.

The market was positive on reports that a US default could be avoided as President Joe Biden and Speaker of the House of Representatives Kevin McCarthy agreed on the main terms for raising the national debt limit over the weekend. Today, the bill will go through the approval process in Congress, while the vote in the Senate is expected only at the end of the week. Meanwhile, US Treasury Secretary Janet Yellen clarified that the government will not be able to fulfill its debt obligations from June 5, but most investors are confident that the budget agreement will be approved before this date.

The macroeconomic statistics from the US and the UK, published the day before, did not have a significant impact on the dynamics of the instrument. One way or another, the Retail Price Index from the British Retail Consortium (BRC) rose again from 8.8% to 9.0% in April, indicating continued inflationary pressure. In turn, the Housing Price Index in the US in March corrected from 0.7% to 0.6%, while analysts expected a decline to 0.2%, and in annual terms, the figure was -1.1% after an increase of 0.4% in the previous month and with a forecast of -1.6%. Dallas Fed Manufacturing Business Index in May fell from -23.4 points to -29.1 points, which turned out to be significantly worse than preliminary estimates of -19.6 points.

Meanwhile, British Chancellor of the Exchequer Jeremy Hunt announced the need to continue the "hawkish" course of monetary policy, despite the rising risks of a recession. The official explained that economic recovery is possible only in the event of a complete victory over inflation, which in the previous month showed a slowdown from 10.1% to 8.7% in annual terms and updated the March 2022 low. However, statistics showed that consumer food prices in the UK rose 19.1% in March compared to the same period last year (rising to a high of August 1977), but in April the figure corrected to 17.3%. Hunt says food inflation disproportionately affects low-income households, who spend the most on food and are less able to use cheaper commodity alternatives. The government is scheduled to consider updating the pricing rules following a study by the UK Competition and Markets Authority (CMA).

Support and resistance

On the D1 chart Bollinger Bands are trying to reverse horisontally. The price range is almost constant, remaining rather spacious for the current level of activity in the market. MACD is growing preserving a weak buy signal (located above the signal line). Stochastic is showing a more confident growth and is located in the middle of its area.

Resistance levels: 1.2450, 1.2500, 1.2550, 1.2600.
Support levels: 1.2390, 1.2350, 1.2307, 1.2236.

GPBUSD310523-33.png


GPBUSD310523-333.png


Trading tips

Short positions may be opened after a breakdown of 1.2350 with the target at 1.2236. Stop-loss — 1.2410. Implementation time: 2-3 days.

A rebound from 1.2350 as from support followed by a breakout of 1.2400 may become a signal for opening new long positions with the target at 1.2500. Stop-loss — 1.2350.

Use more opportunities of the NPBFX analytical portal: weekly FOREX forecast

You can learn more about the current situation and get acquainted with the weekly analytical forecast in the "Video reviews" section on the NPBFX portal. Weekly video reviews contain trends, key levels, trading recommendations for such popular instruments as GBP/USD, EUR/USD, USD/CHF, AUD/USD. In order to get free and unlimited access to video forecast and other useful instruments on the portal, you need to register on the NPBFX website.

If you have any questions about trading instruments, you can always ask an analyst in the online chat on the portal and get a free consultation of an experienced specialist.

Use the current recommendations of analysts on GBP/USD and trade efficiently with NPBFX.
 
Meta Platforms Inc.: technical analysis 02.06.2023

Good afternoon, dear forum visitors!

NPBFX offers the latest release of analytics on Meta Platforms Inc. for a better understanding of the current market situation and more efficient trading.

Shares of Meta Platforms Inc., the US multinational holding company that owns technology conglomerate and social media giant Facebook, are trading at 272.00.

A correction trend is forming on the daily chart, within which the price is heading toward the channel resistance line with dynamic boundaries of 300.00–245.00.

On the four-hour chart, the prospects for a continuation of the upward momentum have noticeably increased after the quotes consolidated above the 100.0% underlying trend level of the Fibonacci extension of 268.00. The next upside target is the 161.8% full trend level of the Fibonacci extension at 292.00.

Technical indicators keep a buy signal: fast EMAs on the Alligator indicator are moving away from the signal line, and the AO histogram is forming rising bars, rising in the buying zone.

META-020623-11.png


Trading tips

Long positions may be opened after the price rises and consolidates above 278.00 with the target at 292.00. Stop loss – 270.00. Implementation period: 7 days or more.

Short positions may be opened after a reversal, reduction, and consolidation of the price below 268.00 with the target at 253.50. Stop loss – 275.00.

Use more opportunities of the NPBFX analytical portal: analytics

You can find more actual analytical reviews on other popular currency pairs, metals and CFDs on the NPBFX online portal. Daily analytics with charts, current market prognoses and trading scenarios in the Feed section are available. Get free and unlimited access to the online portal after registering on the official website of NPBFX Company.

If you have any questions about trading instruments, you can always ask an analyst in the online chat on the portal and get a free consultation of an experienced specialist.

Use the current recommendations of analysts on Meta Platforms Inc. and trade efficiently with NPBFX.
 
Back
Top