Vlad RF
RoboForex Representative
- Messages
- 487
How to Trade “Tasuki Gap” Pattern?
Author: Victor Gryazin

Dear Clients and Partners,
In this article, we’ll discuss the rules and methods of trading the “Tasuki Gap” pattern. You won’t find it very often, but it’s a quite strong pattern of trend continuation from the candlestick analysis.
How the “Tasuki Gap” pattern is formed
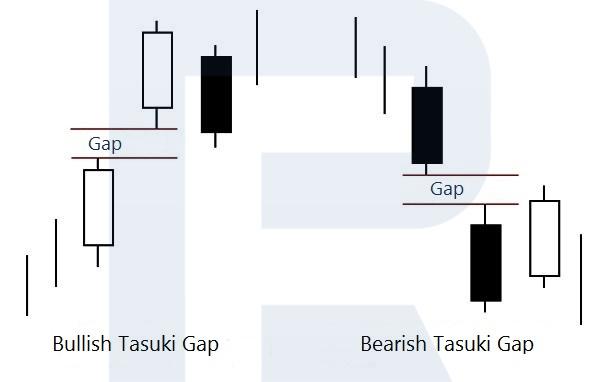
The “Tasuki Gap” candlestick pattern is formed during an ascending or descending tendency and predicts its further development. The pattern consists of three candlesticks: the first two have the same body colour with a price gap between them; the third candlestick has an opposite body colour and returns the price into the gap (between the first two candlesticks).
The first two candlesticks of the pattern show the trend direction and confirm its strength – the gap between them is evidence of that. The third candlestick, which is closed in the opposite direction, is a correction towards the previous movement. This candlestick shouldn’t eliminate the gap with its closing price – if it happens, trading the pattern is not recommended.
Bearish Tasuki Gap
“Upside Tasuki Gap” is formed during a descending tendency: bears dominate the market and believe that the decline will continue. The black bearish candlestick appears on the chart. Later, under the influence of active sales on the market, the next candlestick is opened with a gap to the downside and closed with a black body candlestick.
After that, the price is forming an ascending correction, during which a white bullish candlestick appears and makes the price return to the gap. This gap is now a resistance level. Here, bears start selling again and if bulls couldn’t close the session above the gap, then bears are very likely to resume the downtrend and update the local low.
Recommendations for trading the “Tasuki Gap” pattern
When trading this pattern, one should pay attention to the following:
The “Tasuki Gap” candlestick pattern appears during an ascending or descending tendency (bullish or bearish respectively) and predicts its further development. Excellent addition to the pattern is technical analysis.
Before using the pattern in real trading, one should learn past statistics and historic records and practice on a demo account.
Read more at R Blog - RoboForex
Sincerely,
RoboForex team
Author: Victor Gryazin
Dear Clients and Partners,
In this article, we’ll discuss the rules and methods of trading the “Tasuki Gap” pattern. You won’t find it very often, but it’s a quite strong pattern of trend continuation from the candlestick analysis.
How the “Tasuki Gap” pattern is formed
The “Tasuki Gap” candlestick pattern is formed during an ascending or descending tendency and predicts its further development. The pattern consists of three candlesticks: the first two have the same body colour with a price gap between them; the third candlestick has an opposite body colour and returns the price into the gap (between the first two candlesticks).
The first two candlesticks of the pattern show the trend direction and confirm its strength – the gap between them is evidence of that. The third candlestick, which is closed in the opposite direction, is a correction towards the previous movement. This candlestick shouldn’t eliminate the gap with its closing price – if it happens, trading the pattern is not recommended.
Bearish Tasuki Gap
“Upside Tasuki Gap” is formed during a descending tendency: bears dominate the market and believe that the decline will continue. The black bearish candlestick appears on the chart. Later, under the influence of active sales on the market, the next candlestick is opened with a gap to the downside and closed with a black body candlestick.
After that, the price is forming an ascending correction, during which a white bullish candlestick appears and makes the price return to the gap. This gap is now a resistance level. Here, bears start selling again and if bulls couldn’t close the session above the gap, then bears are very likely to resume the downtrend and update the local low.
Recommendations for trading the “Tasuki Gap” pattern
When trading this pattern, one should pay attention to the following:
- “Tasuki Gap” must be formed within an ascending or descending tendency, it’s better not to trade it inside a sideways channel (flat).
- The pattern’s third candlestick mustn’t close the gap completely with its body. In this case, a trading signal is cancelled.
- The pattern materialization probability increases in the combination with price patterns, support and resistance levels, signals of trading indicators.
- It is recommended to use H4 of longer timeframes.
The “Tasuki Gap” candlestick pattern appears during an ascending or descending tendency (bullish or bearish respectively) and predicts its further development. Excellent addition to the pattern is technical analysis.
Before using the pattern in real trading, one should learn past statistics and historic records and practice on a demo account.
Read more at R Blog - RoboForex
Sincerely,
RoboForex team