Technical Analysis by Admiral Markets

Technical Overview: NZDUSD, NZDJPY, EURNZD And NZDCHF

NZDUSD


Having bounced from 0.6450-60 horizontal support, the NZDUSD managed to test the highest level in nearly a month; however, eight month old descending trend-line resistance, near 0.6665-70, may limit its further upside, favoring a pullback to 0.6590 immediate support, encompassing 50-day SMA and 23.6% Fibonacci Retracement of its April – September downside. Should the pair continue observing the descending trend-line and breaks 0.6590, it can re-test 0.6450-60 support, breaking which 0.6380 is likely an intermediate support level before the pair could aim for September lows of 0.6235. Moreover, an extended decline below 0.6235 can make the pair vulnerable enough to test 61.8% FE of the said April – September south-run, around 0.5960-50 area. Meanwhile, a sustained break above 0.6670 can trigger the pair's advance towards 38.2% Fibo, near 0.6800 – 0.6810, surpassing which 0.6900 may act as a buffer during the pair's northward trajectory towards clearing 0.7000 psychological magnet.
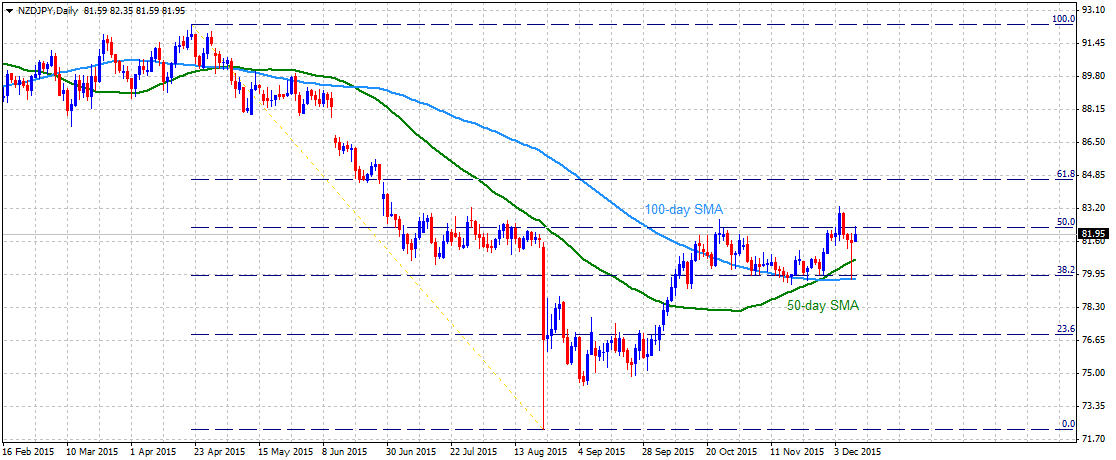
NZDJPY


Even if the NZDJPY witnessed a pullback from more than three months old ascending trend-channel resistance during late-September, 80.00 round figure mark, also including the 50-day SMA, support-line of the mentioned channel and 38.2% Fibonacci Retracement of its April – August downside, triggered the pair's current north-move that fueled it towards the highest levels in more than a month. From the present levels, 82.30, encompassing 50% Fibo level, is likely immediate resistance for the pair before it could aim for 83.00 psychological mark while successful encounter of 83.00 is likely to witness 200-day SMA, currently at 84.00, as a strong upside resistance. Given the pair's ability to surpass 84.00, 61.8% Fibo, near 84.70, and the channel resistance, around 85.60, are expected consecutive resistance that the pair could face during its following up-move. On the downside, 81.00 and the mentioned 80.00 become nearby supports that the pair could witness if it reverses back while daily closing below 80.00 can quickly open the door for the pair's downside to 78.50 and then to the 23.6% Fibo, near 77.00 mark. Should the pair keep following the downtrend after breaking 77.00, it becomes vulnerable enough to plunge towards 75.00 support level.
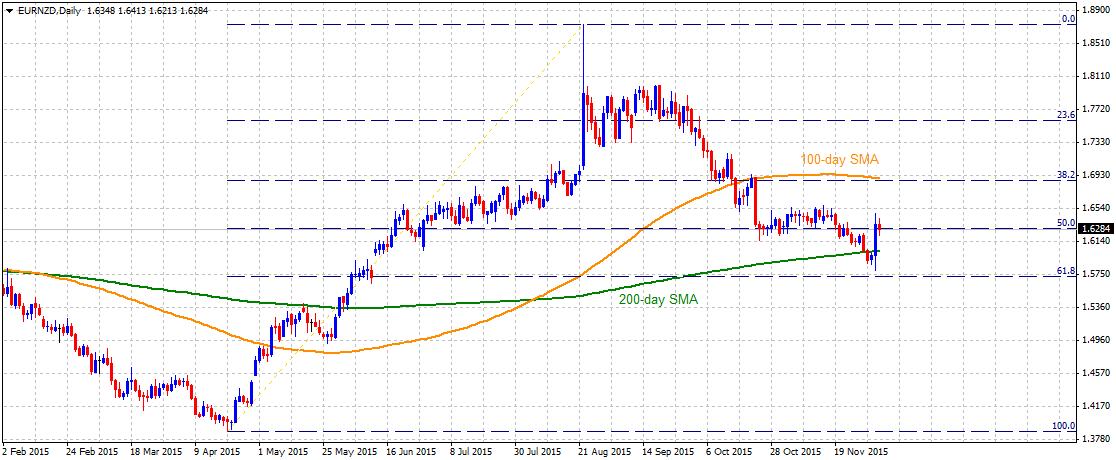
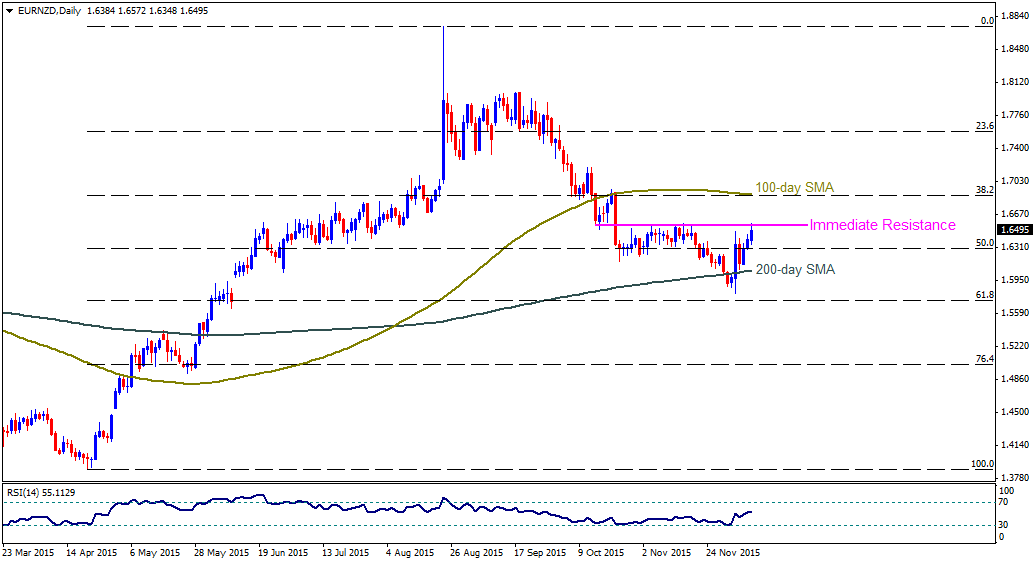
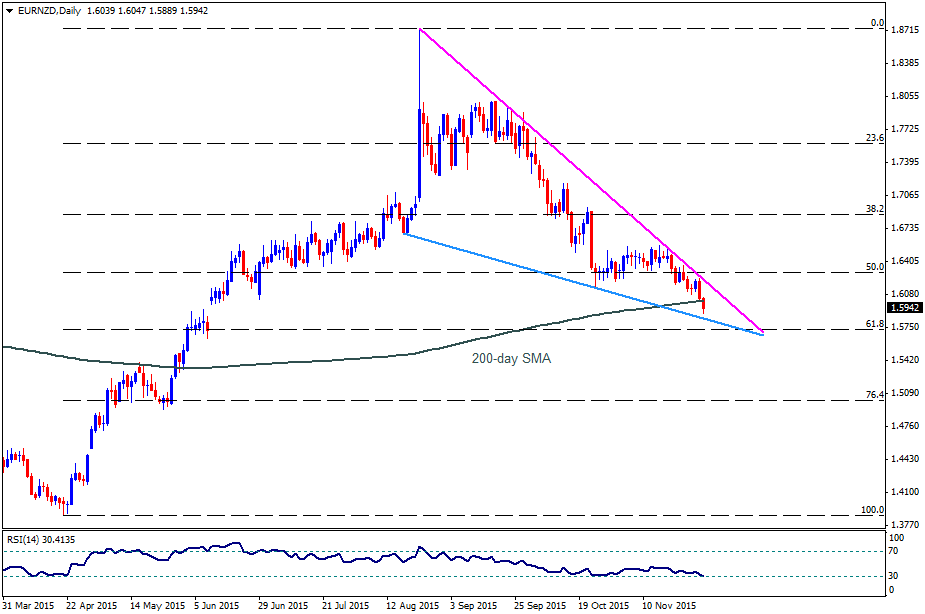
EURNZD


Although four month old descending trend-line resistance forced the EURNZD towards breaking 200-day SMA, the lower trend-line support, connecting August lows to September lows, near 1.5830-25, can help witness a bit of pullback by the pair. However, failure to stop the sellers at 1.5825 may have another opportunity near 61.8% Fibonacci Retracement of April – August rally, at 1.5730-25, to trigger the bounce or else the pair becomes weaker enough to test May highs of 1.5350 while 1.5500 mark can act as intermediate support. Alternatively, a daily close above 200-day SMA, presently near 1.6020, is likely fueling the pair towards testing the mentioned four month old descending trend-line resistance of 1.6215-20, breaking which 1.6300 round figure mark, comprising 50% Fibo, and the 1.6550, are likely following resistance that it could witness during the short-covering up-move. If the pair manage to surpass 1.6550 on a closing, chances of its near-term downside gets negated and it can aim for 1.6825-30 resistance-area.
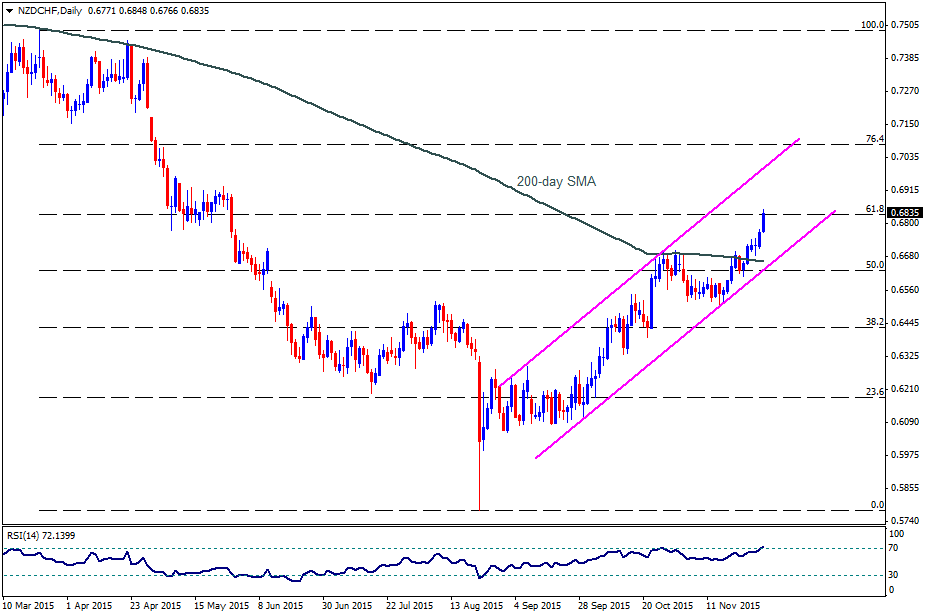
NZDCHF


Irrespective of the NZDCHF's rally towards the highest levels in more than six months, the 61.8% Fibonacci Retracement of its March – August downside, around 0.6830, followed by the 0.6900 round figure mark and the 0.7000 psychological magnet, which also includes three month old ascending trend-channel resistance, can signal brighter chances for the pair's pullback to 0.6700 immediate support. However, the 200-day SMA, near 0.6660 and the channel support, together with the 50% Fibo, near 0.6630, are likely important downside levels that could limit the pair's further decline below 0.6700. Should the pair closes below 0.6700, it can quickly drop to 0.6520 – 0.6500 multiple support area, breaking which 38.2% Fibo, near 0.6430 and the 0.6300 are expected levels that it could witness during sustained south-run. On the upside, a clear break above channel resistance of 0.7000 may propel the pair's rally to 0.7085 – 0.7100 zone, breaking which 0.7200 area becomes good to watch upside region that can control the pair bulls.


“Original analysis is provided by Admiral Markets
 
USDJPY, EURJPY and CADJPY: Technical Check

USDJPY


Even if the USDJPY managed to clear its three month old 118.00 – 121.50 rectangle formation during early November, also depicting a rally to the August highs, another short-term rectangle pattern, between 123.60 and 122.00, representing 76.4% and 61.8% Fibonacci Retracements of its June – August downside, seem limiting the pair's near-term trades. However, sustained trading above 200-day SMA, coupled with comparative USD strength, favors more of the upside than the otherwise. Should it closes above 123.60, the six month old descending trend-line, around 124.30, may offer strong resistance to limit the pair's further advance, breaking which it can quickly rise to August highs of 125.30. Alternatively, a daily close below 122.00 can quickly drag the pair towards 200-day SMA of 121.50-45 before testing the 50% Fibo of 121.00 round figure mark. Moreover, sustained downtrend below 121.00 may find multiple supports within 120.60-50, clearing which can make the pair vulnerable enough to test sub-119.00 support-area.

EURJPY


Ever since the EURJPY dipped below 133.00, it kept following the short-term descending trend-channel formation; though, 76.4% Fibonacci Retracement Level of its April – June rally, near 129.65-60, recently provided a short-covering pullback to the pair prices which is likely to be tamed by the mentioned channel's resistance, around 131.20. Given the pair's capacity to surpass 131.20, the 61.8% Fibo, near 131.80, and the 133.00, quickly followed by the 50% Fibo of 133.50, are likely consecutive upside levels that it could witness during sustained advance. Moving further on the north-side after breaking 133.50, the pair might aim for 135.00 psychological level. Meanwhile, a daily close below 129.60 might witness 129.00 round figure mark, representing the channel support, as a strong level, breaking which the pair can quickly drop to 128.00 and the 127.50 levels prior to targeting April lows around 126.00 support mark.

CADJPY


Five months old descending trend-line resistance, coupled with 100-day SMA, seems favoring the CADJPY downside; however, 50-day SMA, presently around 91.90, is likely an immediate support that the pair needs to clear in order to test 91.00 support level. On a further downside below 91.00, the 23.6% Fibonacci Retracement level of its June – August south-run around 90.60 and the 90.00 psychological magnet become strong support levels for the pair breaking which it can quickly drop to 88.80-70 horizontal support area. Meanwhile, an upside close above 92.50-60 immediate resistance-zone, encompassing the mentioned trend-line, 100-day SMA and the 38.2% Fibo, can quickly fuel the pair to 93.25-30 horizontal resistance mark, breaking which 50% Fibo, near 94.30, and the 95.00 are the resistances that the pair might aim for.

“Original analysis is provided by Admiral Markets
 
Technical Update - USDCHF, CHFJPY, EURCHF and CADCHF

USDCHF


Although the pair remains within a well-established ascending trend-channel formation on 4-hourly chart, it seems to face difficulty in sustaining its strength above 61.8% Fib. expansion level resistance near 1.0300 mark. The pair is now trading close to the lower trend-line support of the channel, currently near 1.0230 level. Should the pair fail to hold and decisively breaks below this immediate support, it seems to extend its near-term corrective move towards testing its immediate major support near 1.0140-20 area, marking 23.6% Fib. retracement level of Oct. - Nov. up-swing. Alternatively, should the pair continues holding the trend-channel support and subsequently manages to sustain strength above 1.0300 mark, it could possibly be headed towards testing the upper trend-line resistance of the channel, currently near 1.0400 round figure mark.

CHFJPY


Extending its downward trajectory, as depicted by a descending trend-channel formation on daily chart, the pair dropped below March lows but has managed to bounce from 100% Fib. expansion level support. With RSI just moving back above 30 from oversold conditions, the pair could possibly extend the recovery, initially towards 120.50-60 horizontal resistance before heading towards 61.8% Fib. expansion level support break now turned resistance near 121.00-121.10 area. Meanwhile on the downside, the pair might continue finding immediate support near 119.00 mark, which if broken decisively might continue dragging the pair lower. Below 119.00 mark support, the pair might continue with its depreciating move towards 117.00 mark with 116.00 round figure mark acting as intermediate support.

EURCHF


Even as the pair failed to extend its up-move beyond 1.1000 psychological mark resistance and reversed from the upper trend-line resistance of a ascending trend-channel formation on daily chart, it has managed to hold and bounce from the lower trend-line support of the channel. Moreover, on shorter time-frame, the pair has also negated a short-term descending trend-channel. Hence, from current levels the pair seems more likely to resume its near-term upward trajectory. The momentum is likely to be reinforced once the pair moves back above 1.0900 mark immediate resistance. Sustained strength above 1.0900 mark now seems to assist the pair in reclaiming 1.1000 mark resistance, which if conquered has the potential to continue boosting the pair in the near-term towards testing the upper trend-line resistance of the channel. On the downside, the short-term descending trend-channel break-out point, also coinciding with the lower trend-line support of the ascending channel, near 1.0850 region, now seems to provide immediate strong support for the pair. Failure to hold this immediate strong support seems to open room for an immediate downfall towards 1.0700 level horizontal support.

CADCHF


The pair remains within a short-term ascending trend-channel formation, visible on daily chart, and is currently witnessing a pull-back from the upper trend-line resistance of the channel. Should the pair continue with its near-term pull-back and weakens below 0.7650 level, it is likely to drop back towards testing the lower trend-line support of the channel, currently near 0.7630 level. Failure to hold the ascending trend-channel support is likely to continue dragging the pair initially towards 0.7600-0.7590 horizontal support and eventually towards testing 0.7560 support area, marked by 23.6% Fib. retracement level of Aug. lows to Nov. highs up-move. Alternatively, should the pair manages to strengthen back above 0.7700 mark immediate resistance, it is likely to surpass recent highs and head towards testing the upper trend-line support of the channel, currently near 0.7760-70 area.

“Original analysis is provided by Admiral Markets
 
Technical Overview - USDCAD, EURCAD, GBPCAD and NZDCAD

USDCAD


Following its decisive move back above 100-day SMA, the pair seems to consolidate within a broad trading range between 1.3400 resistance on the upside and 1.3250 strong support on the downside. A decisive strength above 1.3400-1.3420 strong resistance is likely to provide the required momentum to lift the pair towards testing an ascending trend-line resistance. Alternatively, weakness below 1.3250 is likely to drag the pair towards another ascending trend-line support, near 1.3200-1.3180 area, also coinciding with 100-day SMA support. The combination of two ascending trend-line support and resistance, seems to constitute towards formation of a bearish Rising Wedge chart-pattern on daily chart. The pattern, however, is not completed until the pair decisively breaks below the lower ascending trend-line support.

EURCAD


Reversal from its highest level since March 2014 and a subsequent break below important support levels has now dragged the pair below 200-day SMA support for the first time since early July. From current levels, the pair seems more likely to continue with its depreciating move towards 1.4000-1.3980 support area, marked by 61.8% Fib. retracement level of April to August up-swing. Sustained weakness below 1.4000 psychological mark is likely to get extended further towards its next major support near 1.3760-50 horizontal area. Meanwhile, a move back above 200-day SMA immediate resistance, currently near 1.4100 mark, is likely to confront a strong resistance at 50% Fib. retracement level near 1.4300 mark. Only a sustained strength back above 1.4300 mark resistance might negate any near-term bearish outlook for the pair, paving way for additional recovery back towards 1.4450-70 intermediate resistance.

GBPCAD


Failure to sustain its recovery strength beyond 100-day SMA resistance and a subsequent reversal from 50% Fib. retracement level of Aug. - Oct. corrective move now seems to continue dragging the pair back towards Oct. month daily closing lows support near 1.9820-1.9800 mark. Failure to register any meaningful recovery from Oct. lows, leading to a further weakness below Oct. swing lows support near 1.9730-20 level, opens room for extension of the pair's near-term corrective move towards testing 61.8% Fib. expansion level support, near 1.9600 mark. Alternatively, a pull-back from Oct. lows support could lift the pair back towards 2.0000 psychological mark resistance, also coinciding with 23.6% Fib. retracement level. Only a sustained strength back above 2.0000 mark could add to possibilities of any further recovery for the pair, possibly towards retesting 100-day SMA region, currently near 2.0200-20 zone.

NZDCAD


The pair's corrective move ended at an important support confluence comprising of 100-day SMA and 23.6% Fib. retracement level of March to August downfall. The pair subsequently managed to clear 38.2% Fib. retracement level and 200-day SMA intermediate resistance level to test 50% Fib. retracement level. The pair is currently holding above its immediate support at 200-day SMA near 0.8820 level. Till the time it continues holding above 200-day SMA, the pair seems to make a fresh attempt to retest 50% Fib. retracement level resistance near 0.8940 level and eventually head towards 0.9000 psychological mark resistance, earlier tested in Oct. Alternatively, weakness back below 200-day SMA is likely to find immediate support at 38.2% Fib. retracement level near 0.8780 level. Failure to sustain strength above 200-day SMA and weakness back below 0.8780 support might now drag the pair back towards retesting 100-day SMA support, which has now move near 0.8600 mark.

“Original analysis is provided by Admiral Markets
 
Technical Check - EURGBP, EURAUD, EURNZD

EURGBP


Extending its rebound from a short-term ascending trend-line support, the pair on Thursday rose sharply to move back above 50-day SMA. The pair tested 50% Fib. retracement level of its Oct.-Nov. downfall and is currently trading below 0.7200 mark important Pivot, representing 50-day SMA. Should the pair continue trading below 50-day SMA and weakens below 38.2% Fib. retracement level support near 0.7175 it seems to be headed back towards retesting 0.7100 mark, representing 23.6% Fib. retracement level, with 0.7150 acting as intermediate horizontal support. Alternatively, should the pair move back above 0.7200 mark and subsequently sustains its strength above 50% Fib. retracement level resistance near 0.7240, it clearly seems to be headed towards its next major resistance near 0.7300 mark, also coinciding with 61.8% Fib. retracement level. Momentum above 0.7300 mark, might now negate any near-term bearish expectation for the pair, thus paving way for continuation of the near-term upward trajectory back towards reclaiming 0.7400 mark.

EURAUD


On Thursday, the pair rebounded sharply from the lower trend-line support of a short-term descending trend-channel formation. The momentum, however, failed to lift the pair beyond the upper trend-line resistance of the channel, currently near 1.4950-60 area. Pull-back from the upper trend-line resistance now seems to find immediate support at 200-day SMA region, currently near 1.4800 mark. Until the pair continues holding above 200-day SMA, it could possibly make another attempt to retest the upper trend-line resistance of the channel. Should the momentum help the pair in conquering the trend-channel resistance, it seems more likely to extend its near-term recovery towards its next major resistance near 1.5200 mark, coinciding with 38.2% Fib. retracement level of August highs to over 5-month lows tested on Thursday. Meanwhile, weakness back below 200-day SMA is likely to drag the pair back towards 1.4750-40 horizontal support, which is closely followed by support near 1.4670-75 zone. Failure to move above the ascending channel and subsequent breaks below immediate support levels now seems to increase the pair vulnerability to resume its near-term downward trajectory and aim towards testing the lower trend-line support of the channel, currently near 1.4360-50 area, with recent daily closing low, near 1.4520 level, acting as intermediate support.

EURNZD


Even as the pair dropped below 200-day SMA, it managed to rebound sharply from 1.5800 mark support, nearing 61.8% Fib. retracement level of April to August up-move. The pair has now moved back above 50% Fib. retracement level and is currently hovering around 1.6300 mark. Should the pair want to follow-up on its sharp up-move yesterday, it need to clear its immediate strong resistance near 1.6500 horizontal zone. Above 1.6500 mark resistance, the pair could easily continue with its appreciating move towards its next major resistance confluence near 1.6900 mark, comprising of 38.2% Fib. retracement level and 100-day SMA. Meanwhile on the downside, 1.6200 mark is likely to act as immediate support, which if broken is likely to drag the pair back towards retesting 200-day SMA, currently near 1.6050-40 region. Further, sustained weakness below 200-day SMA strong support now seems to open room for continuation of the pair's near-term downward trajectory towards testing sub-1.5800 mark, representing 61.8% Fib. retracement level.


“Original analysis is provided by Admiral Markets
 
Technical Outlook - GBPUSD, AUDUSD, USDCAD and USDJPY

GBPUSD


Even as the pair managed to rebound sharply from an important support confluence near 1.4920-1.4900 mark, comprising of the lower trend-line support of a well-established descending trend-channel and 61.8% Fib. expansion level, the rebound failed to extend the pair's recovery beyond an intermediate horizontal resistance near 1.5150-60 zone. The has now dropped back below 1.5000 psychological mark and now seems to continue with its downward trajectory back towards 1.4920-1.4900 important support. Sustained weakness below 1.4900 mark strong support has the potential to continue dragging the pair towards testing its next major support near 1.4700 mark, representing 100% Fib. expansion level in the near-term. Any attempts of recovery from current levels might confront immediate resistance near 1.5050 level, which if cleared might now assist the pair to conquer 1.5150-60 resistance and extend its near-term recovery towards testing its next major resistance near 1.5350 region, also nearing the very important 200-day SMA.

USDCAD


After consolidating in a narrow trading range, the pair finally has managed to break on the upside and has now moved above 1.3500 round figure mark for the first time since June 2004. From current levels, the pair seems more likely to continue with its appreciating move towards testing an ascending trend-line resistance, currently near 1.3680-1.3700 mark. On medium-term chart, this ascending trend-line resistance, along-with another ascending trend-line, which has been acting as an important support on the downside, seems to constitute towards formation of a bearish Rising Wedge chart pattern formation. The formation, however, is not completed unless the pair decisively breaks below the lower ascending trend-line support, currently near 1.3200-1.3180 region, also coinciding with 100-day SMA. Meanwhile on the downside, the trading range resistance break-out point near 1.3400 mark now seems to act immediate support for the pair. Failure to hold this resistance turned immediate support area is likely to drag the pair back towards 1.3250 support, before it makes an attempt to test the very important support confluence near 1.3200-1.3180 region.

AUDUSD


Although, the pair decisively moved above 100-day SMA, it once again failed to clear 0.7370-80 strong resistance marked by 50% Fib. retracement level of June high to Sept. low downfall. The pair has subsequently dropped back to 100-day SMA support near 0.7200 region. Should the pair fail to bounce back from 100-day SMA support and sustains its weakness below 0.7200 mark, it could possibly extend its reversal, initially towards 23.6% Fib. retracement level intermediate support near 0.7130 level before heading towards a short-term ascending trend-line important support, currently near 0.7070-60 area. Further, a decisive weakness below the trend-line support might now expose the pair towards retesting its recent lows support near 0.6930-10 region and eventually aim lower towards testing sub-0.6800 mark support. Meanwhile, a bounce back from current support level is likely to confront immediate resistance at 38.2% Fib. retracement level near 0.7270-75 area, which if cleared is likely to lift the pair back towards the very important resistance near 0.7370-80 area.

USDJPY


On 4-hourly chart, the pair remains within a broad trading range between 123.60-75 resistance on the upside and 122.30-20 support on the downside. Hence, the pair's near-term direction would only be determined once it breaks out of the current trading range. From current levels 123.00-122.90 seems to provide immediate support, followed by another horizontal support near 122.50 level. Important downside support remains near 122.20 level. Weakness below 122.20 level support is likely to get extended immediate towards 121.50 horizontal support. Meanwhile on the upside, 123.60-75 area remains key resistance, which if conquered is likely to set the stage for continuing the pair near-term upward trajectory, possibly back above 125.00 mark towards its recent closing highs resistance near 125.65-70 area with 124.60-70 zone acting as intermediate resistance.


“Original analysis is provided by Admiral Markets
 
EURUSD, EURJPY, EURAUD And EURNZD – Technical Overview

EURUSD


Although Thursday's EURUSD rally couldn't surpass 50-day SMA, the 23.6% Fibonacci Retracement Level of its August highs to recent lows, near 1.0800 round figure mark, triggered the pair's pullback, favoring another attempt by the pair to break mentioned SMA and head towards 1.0980 – 1.1000 important resistance area. However, pair's extended rise beyond 1.1000 may find it difficult to break 1.1110-20 support-turned-resistance region, encompassing 50% Fibo, clearing which it can aim for 1.1260-65 resistance-zone, including 61.8% Fibo level. On the downside, the 1.0800 could continue offering immediate support to the pair, breaking which it can initiate fresh selling with 1.0700 and 1.0630 being intermediate supports before dipping below the recent lows near 1.0530.

EURJPY


Alike EURUSD, the EURJPY also failed to break important SMA but reversed from the Fibonacci Retracement level; however, in case of this pair, it is 100-day SMA and 50% Fibonacci Retracement level of its April – June rally. Presently, 100-day SMA, near 134.60, quickly followed by six month old descending trend-channel resistance, near 135.00 psychological level, are likely immediate resistances to limit the pair's short-term rise. Should the pair manage to clear 135.00 on a closing basis, it becomes strong enough to look for 137.00 upside level while 38.2% Fibo, around 135.40, may provide a buffer resistance during sustained advance. Meanwhile, a daily close below 133.50, representing 50% Fibo, can pull the pair towards 133.00 and the 61.8% Fibo, near 131.80. Moreover, extended downtrend below 131.80 may open the room for the pair's further southward trajectory towards 131.00, the 129.60, comprising 76.4% Fibo, and the mentioned channel support, near 129.00 mark.

EURAUD


Break of eleven weeks old descending trend-channel resistance seems not enough for the EURAUD to trigger a rally towards 1.5600 area as 50-day SMA, presently, near 1.5250, is likely limiting the pair's immediate advance. Should the pair witnesses a pullback from the current prices, it can re-test 1.5000 psychological magnet while sustained downtrend below 1.5000 opens the door for the pair's south-run to 1.4850, the channel resistance-turned-support, and the 1.4800 mark, including 200-day SMA and the 61.8% Fibo of its April – August rally. If the pair breaks 1.4800 mark, chances of its plunge to 1.4650 and the recent lows of 1.4350 can't be denied. Alternatively, 38.2% Fibo, near 1.5480, is an expected nearby resistance to clear for the pair before it could target 1.5600 area while successful rise beyond 1.5600 can fuel the pair's rally towards 23.6% Fibo, at 1.5900, with 1.5770-80 being intermediate stop.

EURNZD


After reversing from 200-day SMA, presently near 1.6060, the EURNZD currently witnesses 1.6560-70 horizontal area as an immediate resistance to break in order to aim for 1.6780 and the 1.6875-80, including 100-day SMA and the 38.2% Fibonacci Retracement of its April – August rise. Given the pair's ability to surpass 1.6880, it can quickly move forth towards 1.7130 and the 1.7250-70 resistance area prior to looking for 1.7500 resistance level. However, failure to surpass 1.6560-70 horizontal resistance can pull the pair back to 1.6300 support, including 50% Fibo, breaking which 200-day SMA, near 1.6060, and the 61.8% Fibo, near 1.5730, are likely consecutive supports that the pair might witness during its extended downturn.


“Original analysis is provided by Admiral Markets
 
Important CAD Pairs - Technical Overview

EURCAD


The pair's sharp rebound from 1.4000 mark support assisted the pair to surpass a short-term descending trend-line resistance and subsequently break-through 1.4600 mark resistance, representing 38.2% Fib. retracement level of April to August up-swing. From current levels, the pair seems more likely to extend its upward trajectory towards testing its next major resistance near 1.5000 psychological mark, nearing 23.6% Fib. retracement level, which could further get extended towards 1.5100 mark resistance. Sustained strength above 1.5100 mark resistance now seems to open room for continuation of the pair's appreciating move towards 1.5400-20 resistance zone, marking Aug. daily closing high level. Meanwhile, reversal from current levels and a subsequent drop back below 1.4750 immediate horizontal support seems to drag the pair back towards 38.2% Fib. retracement level support near 1.4600-1.4580 zone. Failure to hold 1.4600 mark support might now negate possibilities of any further recovery, dragging the pair back towards 1.4300 mark support, representing 50% Fib. retracement level.

AUDCAD


The pair seems to face difficulty in extending the descending trend-channel break-out point and sustain its strength above 0.9800 mark. The pair is currently hovering around 50% Fib. retracement level of April to September down-move and close to the descending trend-channel resistance break-point now turned immediate support. Until the pair continues holding above 0.9750 immediate support, it could possibly make a fresh attempt to move above 0.9800 mark and subsequently head towards its next major resistance near 0.9900 mark, representing 61.8% Fib. retracement level. Alternatively, weakness back below 0.9750 immediate support has the potential to drag the pair back towards 38.2% Fib. retracement level support, near 0.9600 mark. Sustained weakness below 0.9600 mark might consider the current break-out as fake-out, thus increasing the pair's vulnerability to drop back towards 0.9400 mark support, coinciding with 23.6% Fib. retracement level.

CADJPY


Led by renewed weakness in crude oil prices, the pair once again failed to sustain its move above 93.00 mark and conquer 100-day SMA. The pair has now dropped back towards testing its immediate important psychological mark support near 90.00 mark. Weakness below 90.00 mark seems to get extended further towards August closing lows support near 89.00 mark, which if broken has the potential to drag the pair back towards August swing lows support near 87.50 level. On the upside, recovery beyond 90.70 level immediate resistance is likely confront strong resistance near 91.70 horizontal area. This is closely followed by 100-day SMA resistance, currently near 92.20-30 area. Decisive move above 100-day SMA is likely to provide the required momentum to assist the pair in surpassing 93.00 strong resistance and lift further towards its next major resistance near 94.00-94.20 zone.

GBPCAD


Following its big up-surge from 1.9850 odd level, the pair reclaimed 2.0000 psychological mark and conquered an important resistance confluence near 2.0250-70 area, comprising of 100-day SMA and a short-term descending trend-line resistance. From current levels, any further up-move is likely to confront immediate resistance near 2.0500 mark, representing 61.8% Fib. retracement level of Aug. to Oct. down-leg. Momentum above 2.0500 mark, leading to strength above 2.0550 level opens room for resumption of the pair upward trajectory toward retesting August high level resistance near 2.0950 region in the near-term. Alternatively, should the pair starts reversing its gains from 61.8% Fib. retracement level, and drop below 50% Fib. retracement level immediate support near 2.0350 level, it could possibly extend its fall back towards the important resistance confluence break-point now turned strong support near 2.0250 level. Weakness below 2.0250, leading to a drop below 2.0200 mark has the potential to drag the pair further towards retesting 2.0000 psychological mark support, also coinciding with 23.6% Fib. retracement level.


“Original analysis is provided by Admiral Markets
 
Technical Outlook - NZDUSD, GBPNZD, NZDJPY and AUDNZD

NZDUSD


Following its drop back below 0.6600 mark, nearing 23.6% Fib. retracement level of April to Sept. downfall, the pair rebounded sharply and managed to hold 50-day SMA immediate support on daily closing basis. The up-move, however, is facing resistance at a short-term descending trend-line near 0.6770-80 area. Should the pair manage to clear this immediate hurdle and break-through 38.2% Fib. retracement level barrier near 0.6800 mark, it could immediately head toward testing the very important 200-day SMA resistance, near 0.6890-0.6900 zone. Further, a sustained strength above 200-day SMA, for the first time since August 2014, might now pave way for continuation of the pair's near-term recovery, possibly even beyond 0.7000 mark intermediate resistance (50% Fib. retracement level), towards its next major resistance near 0.7150-60 area, marked by 61.8% Fib. retracement level. Alternatively, reversal from the descending trend-line resistance might continue to find immediate support at 50-day SMA, currently near 0.6630 level, which is closely followed by an important support confluence near 0.6590 level (comprising of an ascending trend-line support and 23.6% Fib. retracement level) and 100-day SMA support near 0.6550 region. Reversal from immediate resistance level and a subsequent weakness below multiple support levels is likely to increase the pair's vulnerability to resume its downward trajectory, initially towards 0.6400 mark intermediate support and eventually towards retesting multi-year daily closing low levels support near 0.6250 level.

GBPNZD


The pair continues to hold and rebound from the very important 200-day SMA support, near 2.2300 mark, also coinciding with 50% Fib. retracement level of April to Aug. up-swing. However, any rebound from 200-day SMA now seems to confront immediate resistance near 50-day SMA and 38.2% Fib. retracement level confluence zone near 2.2950 level. Moreover, 50-day SMA has already crossed below 100-day SMA suggesting continuation of the pair's near-term downward trajectory once it decisively breaks below 200-day SMA support. Should the pair decisively weaken below 2.2300 mark important support, it could easily drop towards 61.8% Fib. retracement level support near 2.1520-2.1500 area and fill the price gap witnessed during second trading week of June 2015. Meanwhile, bounce from 200-day SMA support and a subsequent strength above 2.2950 immediate strong resistance confluence, might continue supporting further up-move for the pair. However, any up-move beyond 2.2950 level is likely to be capped at the very important 100-day SMA resistance, currently near 2.3450 level, also nearing highs tested in the month of Nov. Only a sustained strength above 100-day SMA might negate the near-term bearish outlook and pave way for additional near-term up-move for the pair.

NZDJPY


After moving back above 100-day SMA level for the first time since Jan. 2013, the pair witnessed a consolidation phase. During the consolidation phase, the pair continued holding and important support confluence, comprising of 100-day SMA and 38.2% Fib. retracement level of April to August downfall. Moreover, 50-day SMA also crossed-over 100-day SMA, pointing towards possible further near-term upside for the pair. From current levels, should the manage to decisively trade above 50% fib. retracement level (82.30-82.50 area), it could easily aim towards testing 200-day SMA resistance, currently near 83.50-60 zone, also coinciding with a short-term ascending trend-line resistance. Further, a decisive break-through 83.50 resistance confluence now seems to pave way for continuation of the near-term upward trajectory, initially towards 61.8% Fib. retracement level resistance near 84.50-60 area, before heading towards 87.70-80 region to cover the June price gap. On the downside, 50-day SMA near 80.60 level, followed by 100-day SMA and 38.2% Fib. retracement level confluence near 79.70-60 area, might continue protecting immediate downside for the pair. Only once the pair decisively weakens below this important support confluence, it is likely to negate the near-term bullish outlook.

AUDNZD


Although the pair seems to have found support near 1.0700 level, it continues to trade below 200-day SMA and 50-day SMA important confluence zone and also below 23.6% Fib. retracement level of Aug.-Oct. corrective move. Moreover, the pair has previous made a failed attempt to move back above 100-day SMA and hence, from current levels seems vulnerable to further downside. The same would be confirmed once the pair decisively breaks below 1.0700 mark. Below 1.0700 mark, the pair could easily drop back below 1.0500 mark to retest Oct. lows and subsequently extend its downward trajectory towards testing 61.8% Fib. expansion level support near 1.0320-1.0300 zone. Alternatively, should the pair manage to move back and sustain its strength above 200-day and 50-day SMA confluence region near 1.0840 level, it could possibly make an attempt to retest 100-day SMA and 38.2% Fib. retracement level strong resistance confluence near 1.0960-70 zone. Only a decisive move above 1.0960-70 strong resistance, leading to a subsequent strength above 50% Fib. retracement level resistance near 1.1100 mark, might negate the near-term bearish outlook for the pair.


“Original analysis is provided by Admiral Markets
 
Technical Update: USDCHF, EURCHF, GBPCHF and AUDCHF

USDCHF


Following its break of six month old ascending trend-channel resistance, the USDCHF managed to test the highest levels in more than five years; however, 61.8% FE of its January lows to March highs, near 1.0300, stopped the pair's further upside and dragged it again into the trend-channel formation. The pair currently seems bouncing back to 0.9900 mark from 0.9800 – 0.9820 horizontal support-zone, which also includes 100-day SMA. Should it break the 0.9900 immediate resistance, 1.0030 and the 1.0100 are likely intermediate levels that the pair might look for before re-testing the mentioned channel's resistance, near 1.0140-50. Moreover, a sustained break of 1.0150 can propel the pair's upward trajectory to surpass recent highs of 1.0330. On the downside, a close below 0.9800 can pull the pair to 0.9700 and the 0.9570-60 support area before testing the channel support, near 0.9460-50. Given the pair's inability to hold 0.9450, chances of its quick plunge to 0.9250, which opens door for 0.9100 support test, becomes brighter.

EURCHF


Reversal from three month old descending trend-channel resistance, also including the 1.0940-50 horizontal area, pulled the EURCHF below 100-day SMA; however, 1.0800 seems limiting the pair's immediate downside while the mentioned SMA, near 1.0840, quickly followed by the 23.6% Fibonacci Retracement of its April – September advance, near 1.0860, are likely nearby resistance for the pair to clear. Comparative weakness of the EUR and a sustained dip below 100-day SMA favors more of the downside by the pair than the otherwise, indicating 38.2% Fibo re-test, near 1.0730 prior to aiming for the channel support, near 1.0695 – 1.0690. Moving forward, the pair's further downside below 1.0690 may find it difficult to break 1.0645-40 support-zone, including 200-day SMA and 50% Fibo, breaking which it becomes vulnerable to test 61.8% Fibo at 1.0540. Alternatively, a break above 1.0860 might fuel the pair to 1.0900 and the 1.0940-50 area, surpassing which the pair can quickly surpass 1.1000 area and aim for September highs near 1.1050.

GBPCHF


Failure to surpass the 61.8% FE of May – August rally currently pulls the GBPCHF to 1.4800 – 1.4790 ascending trend-line support, also comprising 200-day SMA; however, 1.5020-25 can act as an immediate resistance for the pair. Should it surpasses 1.5025, the pair can quickly rise to 1.5110-20 horizontal resistance prior to rising towards 1.5200 round figure mark while an extended up-move beyond 1.5200 may find it difficult to surpass 1.5300 – 1.5320 broad resistance area. Meanwhile a break below 1.4880 nearby support can make it test 1.4800 – 1.4790 important support, breaking which the pair might plunge to 1.4650-40 zone. Moreover, sustained downside below 1.4640 can make the pair weaker enough to test 1.4500 support-region.

AUDCHF


AUDCHF's south-run from 0.7550 is currently experiencing difficulty in breaking four month old ascending trend-channel support, near 0.7100 psychological level. Given the pair's inability to hold 0.7100, the 100-day SMA, near 0.7050, can act as an intermediate support during the pair's extended southward journey towards 0.7000 – 0.6995 mark, also including 38.2% Fibonacci Retracement of March – August downside, breaking which the pair can aim for 0.6880-70 support area re-test. On the upside, a daily close above 200-day SMA, near 0.7190, may find 0.7250 and 0.7320 as consecutive resistances, breaking which 76.4% Fibo, near 0.7460, and the December highs of 0.7550 may again comes into play.


“Original analysis is provided by Admiral Markets
 
Back
Top