Technical Analysis by Admiral Markets

Technical Outlook - Gold, Silver and WTI

Gold


Following its drop below $1050 level, marking the lowest level touched since Jan. 2010 and 61.8% Fib. expansion level, the yellow metal attempted a recovery from the lower trend-line support of a short-term descending trend-channel formation on daily chart. The recovery, however, lost its momentum this week, wiping-off majority of its previous week's gain, dragging the metal back towards a very important support marked by the lower trend-line support of a well-established long-term descending trend-channel formation on weekly chart. From current levels weakness below $1060 level is likely to find immediate support near $1050-45 confluence region, but a weekly close below this important support now seems to trigger a fresh leg of weakening trend for the precious metal, initially towards $1000 psychological mark and eventually towards its next major support near $950 region, marking 100% Fib. expansion level. Meanwhile on the upside, strength above $1070 level might continue to face immediate strong resistance near $1090-1100 mark. Sustained move above $1100 mark, leading to a momentum beyond $1110 level, might open room for further near-term recovery towards its next major resistance near $1150 horizontal zone.
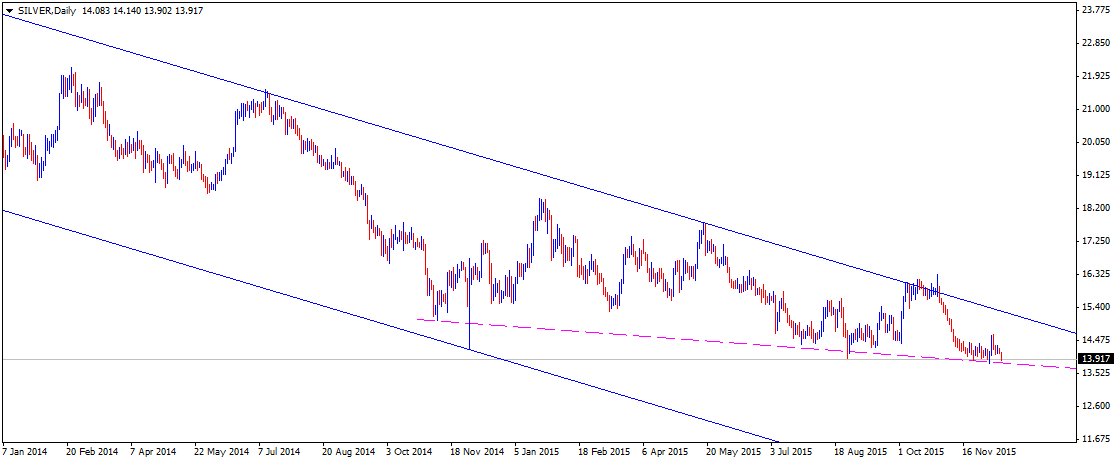
Silver


The white metal, too, continues its downward trajectory within a well-established descending trend-channel formation. The metal is currently trading below $14.00 round figure mark and close to it's a short-term descending trend-line support near $13.75 region. Decisive break-through this immediate support has the potential to accelerate the weakness immediately towards testing its next major support near $12.50 level, marking its lowest level since July 2009. The downward trajectory could further get extended, possibly even below $10.00 psychological mark support, towards testing the lower trend-line support of the descending channel, currently near $9.70-60 area. Meanwhile, a bounce back from current support level and a subsequent strength above $14.00-14.10 immediate resistance, could possibly extend the near-term recovery towards $14.50-60 horizontal resistance area. The recovery could further get extended towards testing the upper trend-line resistance of the descending trend-channel, currently near $15.10-20 area. Unless the white metal continues to oscillate within the descending trend-channel and remains below $15.00 mark strong resistance, it seems more likely to continue its downward trajectory in the foreseeable future.
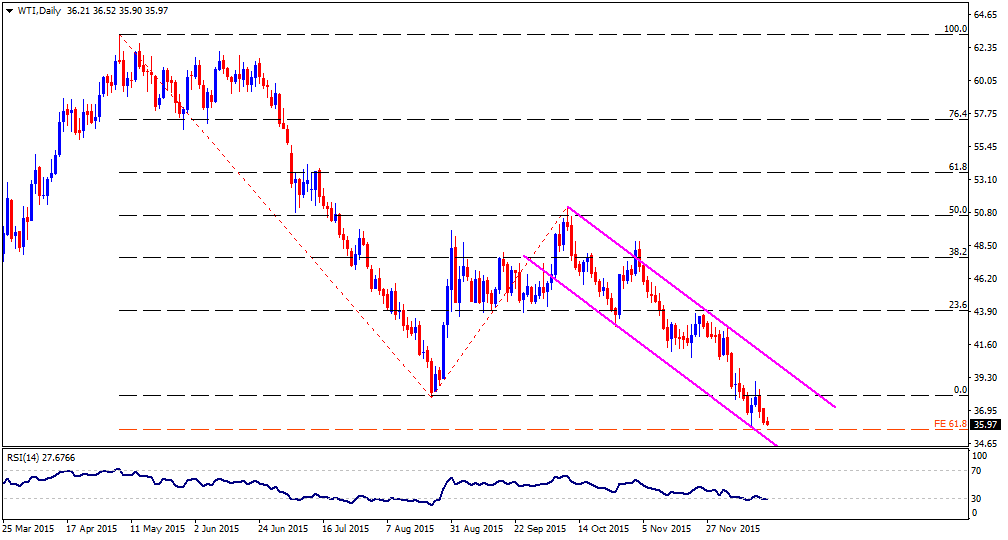
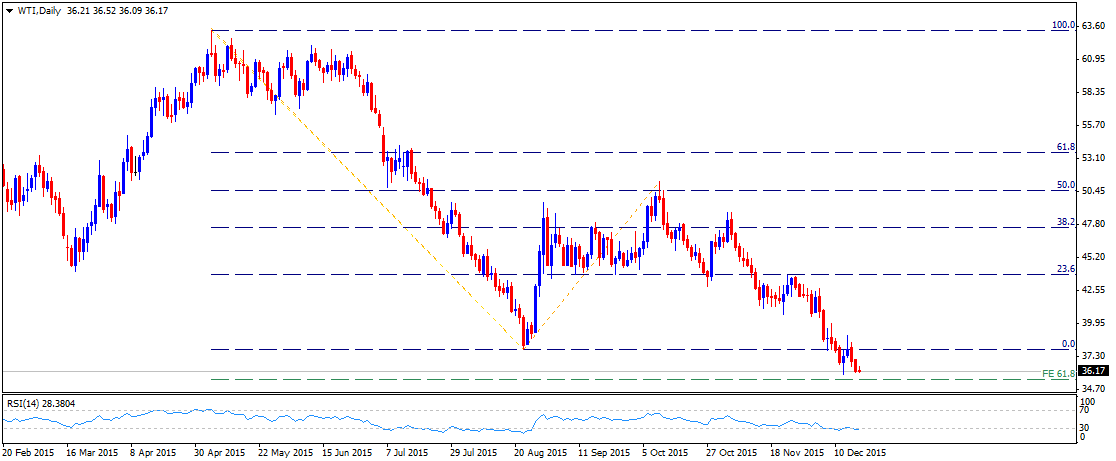
WTI


Rebound from the lowest level since Feb. 2009 failed to sustain above $50 mark resistance, representing 50% Fib. retracement level of May to Aug. downfall. WTI subsequently resumed its downward trajectory and has not dropped to fresh multi-year lower levels. From current levels, WTI seems to extend its ongoing slump towards 61.8% Fib. expansion level support near $35.60-50 area. Weakness below 61.8% Fib. expansion level seems to open room for retest of 2009 lows support near $33.20 area. Meanwhile, any recovery from near-term oversold conditions now seems to confront immediate resistance near $38.80-39.00 horizontal zone. Although, momentum above $39.00 mark resistance might further get extended but now seems to be restricted near $41.00 region, which now seems to have emerged as immediate strong resistance on the upside. However, sustained strength above $41.00 mark, might assist WTI prices to move back towards its next major resistance near $43.50-60 area.


“Original analysis is provided by Admiral Markets
 
Technical Traits: CHFJPY, NZDCHF and CADCHF

CHFJPY


Reversal from seven months old descending trend-line strengthened the CHFJPY towards testing highest level in six weeks; however, the pair failed to surpass 100-day SMA and kept trading between 100-day and 50-day SMA during the current week. With the short-term descending trend-line resistance favoring more of the pair's downside, a clear break below 122.70, including 50-day SMA, quickly followed by the 23.6% Fibonacci Retracement of its June – November downside, near 122.40, can drag the pair down towards 121.50 and the 120.00 psychological magnet. Moreover, a sustained downtrend below 120.00 may find recent low of 118.70 as an intermediate support before it could reverse from the mentioned trend-line support, around 118.00 round figure mark. On the upside break of 124.00 – 124.10 including the mentioned trend-line resistance and 100-day SMA, can quickly fuel the pair to 38.2% Fibo, near 124.80 before aiming the 126.00 resistance mark. Given the pair's ability to extend the upward trajectory beyond 126.00, it can rally towards 127.50-60 resistance area.

NZDCHF


NZDCHF seems failing to sustain the bounce from 50-day SMA and is again indicating the said SMA re-test near 0.6580, breaking which 0.6520 is likely an important support that could open the doors for the pair's further downside to 0.6430-20 support area, including 100-day SMA & 38.2% Fibonacci Retracement of its March – August downside, followed by the three month old ascending trend-channel support, near 0.6360. If the pair fails to bounce from the channel support, it can quickly plunge to 0.6230-20 and the 0.6100 support levels. Alternatively, 0.6700 round figure mark provides immediate resistance to the pair, surpassing which 0.6770-80, the 61.8% Fibo, near 0.6840, and the channel resistance, near 0.6870, are expected consecutive resistances that the pair might test prior to rallying towards 0.6900 psychological resistance level.

CADCHF


On the sustained break of three month old ascending trend-channel, the CADCHF presently trades near the lowest level since late-September; though, 0.7195 – 0.7205 horizontal support, including April – August downside's 23.6% Fibonacci Retracement Level, may provide a pullback to the pair prices. Should it fail to hold the 0.7195 mark, chances of its plunge to August lows, near 0.6970, can't be denied. Meanwhile, a bounce from the current levels may witness 0.7270-80 as immediate resistance, breaking which 38.2% Fibo, near 0.7350 and the 0.7420, are expected upside levels that the pair might aim for. Should the pair manage to clear 0.7420, the 50% Fibo, and mentioned channel support (now acting as resistance) can limit its further up-move near 0.7460.


“Original analysis is provided by Admiral Markets
 
Technical Update: USDCAD, EURCAD, GBPCAD And CADJPY

USDCAD


USDCAD's reversal from 1.3780 is presently finding it difficult to break 1.3680-75 immediate support confluence, including more than a week old ascending trend-line and a horizontal-line support. Should it dip below 1.3675, it can quickly test 1.3620-15 support-zone while failure to hold the same can exert more downside pressure into the pair prices towards testing 1.3530-20 area. Moreover, extended south-run below 1.3520 opens the room for the pair's plunge to 1.3400 round figure mark. On the upside, a pullback from the current levels may find 1.3715-20 as an intermediate resistance before it could re-test 1.3780. Given the pair's ability to surpass 1.3780, chances of its northward trajectory towards 1.4130-50 area becomes brighter; however, 1.3950 and the 1.4020 may act as buffer resistances during the pair's up-move.

EURCAD


Ever since the EURCAD bounce-off from 200-day SMA, it aggressively marched to test the highest levels in more than eleven weeks; however, failure to close above 1.5085 – 1.5100 horizontal resistance area seems currently pulling the pair back to 1.4960-50 support-zone, including 23.6% Fibonacci Retracement of its April – August rally. If the pair breaks down the 1.4950 mark, it can find 1.4850, 1.4660, 1.4620 (the 100-day SMA) and the 1.4580 (38.2% Fibo) as consecutive downside supports during its sustained decline. Though, further downside below 1.4580 could find it difficult to break 1.4380 and 50% Fibo, near 1.4280, breaking which the pair can re-test the 200-day, presently around 1.4160-50. Alternatively, a daily close above 1.5100 can be followed by the 1.5200 round figure mark, clearing which the 1.5430 may act as an intermediate resistance for the pair's fresh up-move towards surpassing the August highs of 1.5560.

GBPCAD


Although GBPCAD managed to clear 2.0360-70 horizontal resistance-turned-support-zone, the 2.0950-70 region, including the August highs, restricted its further advance, favoring a current pullback towards 2.0560-50, which if broken can drag the pair down to 2.0360-70 re-test, which is immediately followed by the 23.6% Fibonacci Retracement of its April – August rally, near 2.0300 and the 100-day SMA, around 2.0270. Given the bears' dominance on the break of 2.0270, the pair can plunge to sub-2.0200 mark prior to testing the 1.9780-60 important support area. Meanwhile, a closing break of 2.0970 can accelerate the pair's northward trajectory towards 2.1050 and the 2.1250 prior to aiming the September 2007 highs, near 2.1500 psychological level.

CADJPY


Following its break of 89.00 – 88.80 horizontal support (now acting as immediate resistance), the CADJPY plunged to re-test the August lows, near 87.50-40; however, pullbacks form the same seems presently favoring the pair's re-test to 88.80 – 89.00 area. Should the pair manage to clear 89.00, the 90.00 psychological magnet, can act as a buffer during its march to 23.6% Fibonacci Retracement of June – August downside, near 90.60-65, breaking which 91.50 and the 100-day SMA, near 92.00 are likely important resistances to limit the pair's further upside. On the downside break of 87.50-40 immediate support, the CADJPY can initiate fresh downside to 87.00 and the 85.80 levels before testing the 61.8% FE of the said move, near 84.75-70.


“Original analysis is provided by Admiral Markets
 
Technical Update - EURUSD, GBPUSD, AUDUSD and NZDUSD

EURUSD


Following its big up-surge on the ECB monetary policy decision announcement day, the pair subsequently conquered 50-day SMA immediate resistance to move back above 1.1000 mark. Momentum above 1.1000 mark now seems to face resistance near 1.1040-60 area, marking 200-day and 100-day SMA regions. Meanwhile, on 4-hourly chart the pair seems to oscillate within a short-term ascending trend-channel formation. Hence, a sustained strength above 1.1040-60 resistance area now seems to pave way for extension of the pair's near-term upward trajectory towards testing upper trend-line resistance of the channel, currently near 1.1160 area. Meanwhile, weakness below the lower trend-line support of the channel, currently near 1.0980 level, leading to weakness back below 50-day SMA support, currently near 1.0940 region, seems to drag the pair back towards 1.0750 support area.

GBPUSD


Although the pair has registered a meaningful recovery from early December lows, but it is yet to clear its immediate strong resistance at 50-day SMA, near 1.5240-50 area. The pair is currently trading close to its immediate resistance turned support near 1.5150-60 zone. Weakness below this immediate support seems to drag the pair back towards retesting 1.5000 psychological mark. Failure to conquer its immediate resistance and a subsequent drop back below 1.5000 psychological mark now seems to open room for extension of the pair's near-term downward trajectory, initially back towards 1.4920-1.4900 important support, which could further get extended towards its next major support near 1.4700 mark, representing 100% Fib. expansion level. Meanwhile on the upside, 1.5240-50 remains immediate resistance to conquer. This is followed by another strong resistance at 100-day SMA, currently near 1.5340-50 region. Sustained strength above 50-day and 100-day SMA resistances has the potential to lift the pair back towards testing the upper trend-line resistance of the channel, currently near 1.5500 mark.

AUDUSD


Although the pair slipped below 0.7200 mark, it still managed to hold 100-day SMA support on closing basis. On a sustained strength above 0.7270-80 immediate resistance, the pair seems all set to aim back towards testing the very important resistance near 0.7370-80 area, which if conquered might confront another strong resistance near 0.7440-50 area, coinciding with 200-day SMA. On the downside, 100-day SMA support near 0.7200 remains important near-term Pivot for the pair. Decisive break and close below 100-day SMA seems to immediately drag the pair towards a short-term ascending trend-line support near 0.7080-70 region, which if broken might open room for a retest of the pair's recent multi-year lows support near 0.6930-10 area. Further, weakness below 0.6900 mark might continue dragging the pair towards testing 0.6800 mark support, representing 61.8% Fib. expansion level.

NZDUSD


On daily charts, the pair has cleared its immediate strong resistance near 0.6770-80 area, representing a short-term descending trend-line and now seems all set to extend its near-term upward trajectory towards testing 200-day SMA resistance, currently near 0.6880 region. Momentum above 200-day SMA, for the first time since August 2014, would now point towards extension of the near-term bullish momentum, initially towards 50% Fib. retracement level of April to Sept. downfall resistance near 0.7000 mark, and eventually towards its next major resistance near 0.7150-60 area, marked by 61.8% Fib. retracement level. On the downside, the descending trend-line resistance break-point near 0.6750 region now seems to act as immediate support. Weakness below this immediate support could get extended but might now be limited at 50-day SMA support, currently near 0.6650 area. Only a decisive break back below 50-day SMA support might negate the near-term bullish expectations for the pair.


“Original analysis is provided by Admiral Markets
 
Technical Outlook: EURAUD, GBPAUD, AUDJPY and AUDCAD

EURAUD


Profit-booking recovery from 76.4% Fibonacci Retracement of April – August rally by the EURAUD seems finding it difficult to break the four month old descending trend-line resistance, connecting highs marked from August top, which in-turn favors fresh downside attempt by the pair towards testing 1.4850 (200-day SMA); however, a closing break below 1.5100 becomes necessary to confirm the near-term south-run. Should the pair dips below 1.4850, the 61.8% Fibo, near 1.4800 round figure mark, and the 1.4650, are likely consecutive supports that the pair might test prior to re-visiting the early month lows around 1.4350. Meanwhile, successful encounter of the mentioned trend-line resistance, near 1.5300, isn't expected to trigger the pair's rally as 100-day SMA, near 1.5385-90, the 38.2% Fibo, near 1.5480, and the 1.5580 – 1.5600 horizontal resistance-zone may limit the pair's further upside. Given the pair's ability to surpass 1.5600, it could quickly rally to 1.5785 – 1.5800 resistance-region before targeting the 23.6% Fibo, near 1.5900 mark.

GBPAUD


Following its reversal from four-month old descending trend-channel resistance, the GBPAUD seems all set to extend its immediate downside to 2.0600 mark, including 200-day SMA and 50% Fibonacci Retracement of its March – August up-move; though, 2.0800 can act as an intermediate support level. Given the pair's inability to hold 2.0600, the pair can accelerate the southward trajectory towards aiming the 2.0200 – 2.0180 support-area, including the mentioned channel's support & 61.8% Fibo, with 2.0400 being a rest point during the decline. However, a closing break above 38.2% Fibo, around 2.1030, can favor the pair's re-test to channel resistance, presently at 2.1200, breaking which 100-day SMA, near 2.1330, can hold the gate for the pair's extended rise towards 2.1540-50 resistance-zone, including 23.6% Fibo.

AUDJPY


Even if the 200-day SMA, coupled with three month old ascending trend-line resistance, triggered the AUDJPY decline towards testing the lowest levels in a month, the channel support, presently around 86.60, seems helping the pair's pullback to 88.50-60, breaking which 89.15 and the 50% Fibonacci Retracement of its May – August downside, near 89.65, are likely following resistances during the pair's extended up-move to re-test 200-day SMA, near 90.50. However, pair's further advance beyond 90.50 are likely to be restricted by the 91.00 – 91.10 area, including the mentioned channel resistance. On the downside, a daily close below 86.60 can quickly fetch the pair to 23.6% Fibo level, near 85.60. Should the pair maintains the south-run intact following 85.60 break, it could aim for 83.00 and the August lows of 82.00 mark, with 84.70 being an intermediate support level.

AUDCAD


Short-term ascending trend-channel helped AUDCAD clear the long-standing downward slanting trend-line from April 2013; though, resistance-line of the mentioned channel, presently at 1.0025-30, triggered the pair's pullback to 0.9840. From the current levels, the pair is expected to test 0.9935-40 and the 0.9975-80 immediate resistances before it could aim for the channel resistance test. Should the pair manage to clear 1.0030, the 1.0045-50 can provide another obstacle for the pair's rise towards surpass 1.0100 mark. Alternatively, a break of channel support, near 0.9850, quickly followed by the mentioned trend-line resistance-turned-support, near 0.9830, could trigger the pair's fresh downside towards 0.9750-40, 0.9660-70, 0.9580 and the 0.9500 round figure mark consecutive support levels.


“Original analysis is provided by Admiral Markets
 
Technical Update - Important JPY Pairs

USDJPY


Following a break below an important horizontal support near 122.30-20 region, the pair nearly dropped to test 120.00 psychological mark. Although the pair has managed to recovery from lower levels, it might now face difficulty in clearing its immediate hurdle near 122.00 mark, representing 50% Fib. retracement level of Dec. high to low swing. Even if the pair manages to clear this immediate barrier, it is likely to confront the previous strong support break-point, now turned immediate strong resistance near 122.20-30 region. However, a decisive break-through 122.20-30 strong resistance opens room for an immediate up-move towards 123.60-75 key resistance area. Momentum above 123.60-75 resistance could further get extended, possibly back above 125.00 mark towards its recent closing highs resistance near 125.65-70 area with 124.60-70 zone as intermediate resistance. Alternatively, failure to conquer 122.00 mark immediate resistance and a subsequent weakness back below its historic support near 121.60-50 zone, also coinciding with 38.2% Fib. retracement level, seems to drag the pair immediately towards 23.6% Fib. retracement level support near 121.10-121.00 mark before heading back towards Monday's low (near 120.40-30) and eventually towards 120.00 psychological mark support, also representing 61.8% Fib. expansion level.

EURJPY


Although the pair seems to move within a short-term descending trend-channel formation on 4-hourly chart, it seems to be in the process of forming a bullish continuation Flag chart-pattern. From current levels, immediate upside resistance is pegged near 133.50 level, marking the upper trend-line resistance of the descending trend-channel. Decisive strength above this immediate resistance, leading to a momentum above 134.00 level, marking 200-day SMA resistance, has the potential to continue boosting the pair towards testing its next major resistance near 136.00 region. This 136.00 level resistance coincides with the upper trend-line resistance of another descending trend-channel formation on daily chart. Meanwhile on the downside, weakness below 133.00 round figure mark is likely to get extended, even below Monday's lows, towards testing the lower trend-line support of the descending trend-channel formation on 4-hourly chart, near 132.00 mark. Failure to hold the Flag chart-pattern support might negate the near-term bullish expectations, dragging the pair back towards 131.00 mark intermediate support before dropping further towards testing its next major support near 129.00 mark, representing the lower trend-line support of the descending trend-channel formation on daily chart.

GBPJPY


After once again failing to clear an important resistance confluence near 186.30-40 area, comprising of 100-day and 200-day SMA, the pair now seems to have broken below a well-established ascending trend-channel support near 183.30 level. The break-down is likely to get confirmed once the pair weakens decisively below 182.00 mark support, representing 50% Fib. retracement level of Oct. 2014 to June 2015 up-move. Below 182.00 mark support is likely to continue drifting lower towards 61.8% Fib. retracement level support near 178.60-50 area, with 180.60-50 horizontal zone acting as intermediate support. On the upside, move above 183.30 ascending channel support break-point, now turned resistance, is likely to confront resistance near 183.85-184.00 mark. Further, any momentum above 184.00 mark now seems to be capped at 50-day SMA and 38.2% Fib. retracement level resistance confluence near 185.00 mark, which now seems to act as near-term strong resistance for the pair.

CHFJPY


The pair's strong recovery momentum from its lowest level since Jan. 2015 helped it to conquer an important resistance confluence near 122.40-60 area, comprising of 50-day SMA and 23.6% Fib. retracement level of June to Nov. 2015 downfall. The momentum subsequently assisted the pair to clear a short-term descending trend-line resistance but has failed to lift the pair beyond 100-day SMA resistance, near 123.90-124.00 mark. From current levels, should the pair continue holding above 122.50 level, which seems to act as Pivot point in determining the pair's near-term direction, it is likely to make a fresh attempt to conquer 100-day SMA resistance. Decisive strength above 124.00 mark resistance is likely to continue boosting the pair, even beyond 125.00 mark intermediate resistance (38.2% Fib. retracement level) towards testing 200-day SMA strong resistance, currently near 125.90-126.00 region. Alternatively, weakness back below 122.50 immediate support is likely to find immediate support near 121.80 level, which if broken decisively seems to drag the pair back towards retesting 119.00 round figure mark support, earlier tested in Nov.

“Original analysis is provided by Admiral Markets
 
Important CHF Pairs: Technical Check

USDCHF


Following its bounce from 0.9790 – 0.9800 support region, including horizontal and ascending trend-line support, 100-day SMA and 50% Fibonacci Retracement of August – November up-move, the USDCHF presently progresses through its 1.0000 immediate horizontal-line resistance. Given its ability to surpass the 1.000 psychological magnet, it could quickly rise to 23.6% Fibo, near 1.0080, the 1.0130 and the 1.0230 consecutive resistances prior to aiming the November highs of 1.0330 while sustained north-run beyond 1.0330 can propel the pair towards 61.8% FE of the said move, near 1.0445-50 area. On the downside, 0.9880 is likely nearby support for the pair before it could re-test the mentioned 0.9800 – 0.9790 support-zone. However, clear break below 0.9790 can fetch pair to 61.8% Fibo, near 0.9670-65 and then to 0.9570 before it could plunge to sub-0.9500 support region.

EURCHF


Even as the EURCHF maintained the gradual decline following the break of nearly six month old ascending trend-line support, 1.0735-40 horizontal-region, including 38.2% Fibonacci Retracement of its April – September advance, may limit the pair's further downside. If the pair fails to hold 1.0740, it can dip to 1.0690 intermediate support before testing 1.0650-40 support-zone, including 50% Fibo and the 200-day SMA. Moreover, the pair's further downside below 1.0640 can find multiple supports near 1.0550-40, including 61.8% Fibo. On the upside break of 1.0860 immediate resistance, including the mentioned trend-line and the 23.6% Fibo, the pair can swiftly move above 1.0900 mark but could find it difficult to break 1.0940-50 resistance-area, breaking which the pair's northward trajectory could aim to surpass September highs of 1.1050.

GBPCHF


Although short-term descending trend-line keep forcing the GBPCHF to trade southward, support-line of broader "Rising-Wedge" bearish formation, near 1.4820, quickly followed by the 200-day SMA near 1.4780 can keep limiting the pair's decline. Should the pair fails to hold 1.4780 and close below the important level, it confirms the bearish technical pattern and can plunge to 1.4510 – 1.4500 horizontal support with 1.4650 being an intermediate rest while further downside below 1.4500 can find multiple supports near 1.4380-70 area. Given the pair's reversal from current levels, which is more likely, it could find the mentioned trend-line, near 1.4930, as an immediate upside levels to break in order to test the 1.5030-35 resistance-zone. Moreover, successful break above 1.5030 can find 1.5120 and the 1.5300 as an intermediate resistance before it could rally to 61.8% FE of the pair's May – August rally, near 1.5515 and then to aim for the November highs of 1.5570.

CADCHF


CADCHF's break below 0.7220-10 horizontal support seems finding it difficult to close below eleven month old ascending trend-line support, presently near 0.7180, favoring a pullback to 0.7300 area if given a close above 0.7220. Should the pair manage to extend its recovery rally beyond 0.7300, the 38.2% Fibo of its January down-turn, near 0.7340 and the 0.7410 are likely consecutive resistance that the pair might witness during its sustained advance before testing the 200-day SMA, near 0.7515. Moreover, successful break above 0.7515 can propel the pair's up-move beyond 0.7600 mark. Alternatively, a daily close below 0.7180 can find 0.7100 as nearby support prior to testing the 23.6% Fibo, near 0.7030 while break of 0.7030 can magnify the pair's downside towards 0.6900 round figure mark. If the pair fails to hold 0.6900, chances of its plunge to January lows, near 0.6530, can't be denied.


“Original analysis is provided by Admiral Markets
 
Technical Update - EURNZD, GBPNZD, NZDJPY and NZDCHF

EURNZD


The pair's rebound from sub-1.5800 mark, nearing 61.8% Fib. retracement level of April to August up-move failed to sustain its move back above 50-day SMA. The pair has now dropped back below 1.6100 mark, representing 200-day SMA and a subsequent weakness below 1.6000 mark is likely to force the pair back towards testing 61.8% Fib. retracement level support near 1.5750 region. Decisive break below 61.8% Fib. retracement level now seems to open room for continuation of the pair's near-term downward trajectory towards testing its next major support near 1.5000 psychological mark. Alternatively, strength back above 200-day SMA immediate resistance near 1.6100 mark now seems to confront a strong resistance near 1.6300 mark confluence region, comprising of 50% Fib. retracement level and 50-day SMA. Even if the pair manages to sustain its strength above 1.6300 mark, for any further up-move it need to conquer 1.6500 strong horizontal resistance, which if cleared could lift the pair back towards its next major resistance confluence near 1.6900 mark, comprising of 38.2% Fib. retracement level and 100-day SMA.

GBPNZD


After failing to hold the very important 200-day SMA near 2.2300 mark important support, the pair has now moved within a short-term descending trend-channel formation on 1-hourly chart. The pair is currently reversing from the upper trend-line resistance of the channel and seems more likely to continue drifting lower towards testing the lower trend-line support of the channel near 2.1970 level. On a decisive break below the short-term descending trend-channel support, the pair seems more likely to continue drifting lower towards 61.8% Fib. retracement level of April to Aug. up-swing support near 2.1520-2.1500 area and fill the price gap witnessed during second week of June 2015. Meanwhile, any attempt of recovery from current levels might now confront immediate resistance near 2.2150 level, which is closely followed by the descending trend-channel resistance near 2.2000 round figure mark. Although momentum above 2.2000 mark is likely to get extended, but is likely to be capped at the very important support turned immediate strong resistance near 2.2300 mark.

NZDJPY


In an attempt to conquer the very important 200-day SMA resistance, the pair seems to consolidate within a short-term ascending trend-channel. The 200-day SMA resistance near 83.60-70 area also coincides with the upper trend-line resistance of the channel and hence, 83.60-70 zone is likely to act as immediate strong resistance for the pair. A decisive break-through this immediate strong resistance confluence is likely to pave way for continuation of the pair's near-term upward trajectory, initially towards 61.8% Fib. retracement level of April to August downfall resistance near 84.50-60 area, and eventually towards covering the June price gap near 87.70-80 region. On the downside, weakness back below 82.00 round figure mark is likely to find immediate support at 50-day SMA region near 81.00 round figure mark. This is followed by a very important support confluence near 79.90-80 area, comprising of the lower trend-line of the channel and 100-day SMA. Only a decisive break below 80.00 important support confluence might negate the near-term bullish outlook for the pair.

NZDCHF


The pair's reversal from 50% Fib. retracement level of Jan. to Aug. 2015 downfall managed to hold 50-day SMA support on closing basis. The pair subsequently has strengthened above an important resistance confluence near 0.6600-0.6620 area, comprising of 38.2% Fib. retracement level, 200-day SMA and now also 50-day SMA. From current levels, the pair seems more likely to extend its near-term appreciating move towards retesting 50% Fib. retracement level resistance near 0.6870-80 zone. Decisive strength above this immediate resistance, leading to momentum above 0.6900 mark, seems to pave way for continuing the upward trajectory towards 61.8% Fib. retracement level resistance near 0.7150 region. Meanwhile on the downside, 0.6620-0.6600 resistance break-point now seems to have emerged as immediate strong support. Weakness below 0.6600 mark is likely to drag the pair back towards retesting 100-day SMA support, currently near 0.6430 level with 0.6500 round figure mark acting as intermediate support.


“Original analysis is provided by Admiral Markets
 
Technical Traits: US Dollar Index, Euro Index And Crude

US Dollar Index [I.USDX]


Even if the ECB's disappointment dragged down the US Dollar Index to month's lows, the 50-day SMA, coupled with the Fed rate hike decision, triggered the greenback gauge's reversal. On Thursday, the 99.35-40 horizontal resistance restricted further advanced by the index, favoring a pullback session on Friday; however, a daily close below 98.80 becomes pre-requisite for the gauge to re-test 50-day SMA, also including 38.2% Fibonacci Retracement of its October – December rally, near 98.00 – 97.90 support-zone. Should it extend the south-run below 97.90, it can quickly test 50% Fibo level around 97.15-20, breaking which chances of its plunge 96.30 and the 95.00 can't be denied. Alternatively, on an extended up-move beyond 99.35-40 immediate resistance, the USD gauge may find 99.80 and the 100.50 as consecutive upside levels, clearing which it becomes strong enough to aim the 61.8% FE level near 101.50.

Euro Index [I.EURX]


Following its reversal from 94.65-70, the Euro Index managed to print considerable up-move; however, 100-day SMA, presently around 97.70, limited the gauge's further rise and is currently favoring the index downside towards 96.30, breaking which 95.40-35 and the 94.70-65 may act as intermediate supports before it could re-test the March lows around 94.00. Should it continue dipping into the southward direction, the regional currency's index can become vulnerable to test 61.8% FE of its December 2014 – March 2015 downside, near 92.30. On the upside, 23.6% Fibo, near 97.20, quickly followed by the 100-day SMA, near 97.70, can continue limiting the index north-moves. Should it manage to clear 97.70 on a closing basis, also breaking the 98.00 round figure mark, the index can rise up-to 99.50 mark.

WTI Crude


Irrespective of the Crude's bounce from 61.8% FE of its May – August decline, also comprised of the short-term trend-channel support, the energy price failed to close above August lows and is again expected to re-test the mentioned FE level, near $35.50, breaking which the channel support, around $35.00 can limit further downside of the commodity's price. However, failure to stop its running downside below $35.00, it can plunge to 2009 lows around $33.00. Meanwhile, $37.00 and the August month lows of $37.90, could continue restricting the near-term advance of energy material. If it breaks $37.90, also clearing $38.00 round figure mark, $39.00 and the $40.50, encompassing the stated channel's resistance-line, are likely upside levels that the Crude price may aim for.


“Original analysis is provided by Admiral Markets
 
Technical Check - US Equity Indices and WTI

Dow Jones Index [DJI30]


Following its recovery from August lows, the index now seems to have confined its move within a broad trading range forming a rectangular chart-pattern. The lower end of the trading range, near 17,140-20 area, coincides with 100-day SMA support and 200-day SMA, near 17,540-50 level, seems to act as Pivot-point. The index is currently trading below 200-day SMA but close to 23.6% Fib. retracement level of Aug. to Nov. up-swing immediate support near 17,330-20 area. Weakness below this immediate support could easily extend back towards retesting 100-day SMA support, currently near 17,140-20 zone. Meanwhile, a bounce from current level and a subsequent strength back above 200-day SMA resistance seems to lift the index back towards the upper end of the trading range resistance near 17,900 level, which also coincides with a short-term descending trend-line resistance. Further near-term direction for the index could be determined only once it breaks-out of the current trading range.

Nasdaq100 [NQ100]


Although, the index continues holding above the very important 200-day SMA, it seems to be forming a bearish Double-Top chart pattern near 4740-50 area on daily chart. The pattern, however, is not complete unless the index breaks below an important support near 4470-50 area. A decisive break below the important support has the potential to immediately drag the index towards 4390-80 intermediate horizontal support before dropping further towards its next major support near 4150 region, also coinciding with the projected target of the bearish chart pattern. Meanwhile on the upside, 4600 round figure mark seems to act as immediate resistance, which if cleared is likely to take the index back towards retesting the very important resistance near 4740-50 region. Sustained strength above 4750 strong resistance now seems to trigger a fresh leg of up-move for the index, possibly towards the very important 5000 psychological mark resistance.

WTI


At the beginning of the week, crude oil prices attempted a recovery from multi-year low level tested on Monday. The recovery, however, fizzled immediately dragging it back below $36.00 mark. From current levels, WTI seems to continue with its recent slump towards testing 61.8% Fib. expansion level support near $35.50 region. Decisive weakness below 61.8% Fib. expansion level support might continue dragging it lower towards retesting 2009 lows support near $33.20 zone. However, considering the near-term oversold condition, as depicted by RSI reading below 30, prices could witness some near-term consolidating within a narrow range or could even witness a rebound. Any recovery attempt beyond $37.00 mark immediate resistance might now confront resistance at August and early Dec. lows near $37.80-38.00 area. Momentum above $38.00 mark resistance and a subsequent break-through $39.00 horizontal resistance now seems to support further near-term recovery possibly towards $41.00 mark resistance area.


“Original analysis is provided by Admiral Markets
 
Back
Top