Technical Analysis by Hiwayfx

HiWayFX

Company Representative
Messages
15
EURUSD
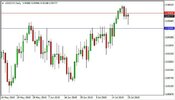
The EURUSD had a bullish momentum yesterday topped at 1.1016. The bias remains bullish in nearest term testing 1.1050/80. Immediate support is seen around 1.0965. A clear break below that area could lead price to neutral zone in nearest term testing 1.0900 area. Potential daily range today is seen between 1.1050 – 1.0900. My major technical outlook remains neutral but like I said yesterday, we might have some bullish run after bounced from 1.0820 key support.
eurusd16-645x371.jpg

GBPUSD
The GBPUSD had a bearish momentum yesterday bottomed at 1.5499. The bias is bearish in nearest term testing 1.5420 area. Immediate resistance is seen around 1.5570. A clear break above that area could lead price to neutral zone in nearest term but overall I prefer a bearish scenario at this phase. Potential daily range today is seen between 1.5570 – 1.5420.
gbpusd15-645x370.jpg

USDJPY
The USDJPY had another indecisive movement yesterday. The bias remains neutral in nearest term. Potential daily range today remains between 123.25 – 124.50. Overall I prefer a bullish scenario at this phase but we need a clear break from the range area to see clearer direction.
usdjpy16-645x370.jpg

USDCHF
The USDCHF attempted to push lower yesterday slipped below 0.9540 support area but whipsawed to the upside and hit 0.9606 earlier today. The bias is bullish in nearest term testing 0.9650. Immediate support is seen around 0.9570. A clear break below that area could lead price to neutral zone in nearest term testing 0.9540/25 area. Potential daily range today is seen between 0.9540 – 0.9650.
usdchf19-645x370.jpg
 
eurusd17-645x370.jpg

EURUSD

The EURUSD failed to continue its bearish momentum last week after unable to make a clear break below 1.0820 key support. The bias is bullish in nearest term testing 1.1050 and the trend line resistance area as you can see on my hourly chart below. Immediate support is seen around 1.0950. A clear break below that area could lead price to neutral zone in nearest term testing 1.0900 region. Potential daily range today is seen between 1.0950 – 1.1050.


eurusd17-645x370.jpg
GBPUSD

The GBPUSD was indecisive last week. The bias is neutral in nearest term. As you can see on my H1 chart below, price is moving below the EMA 200 after formed a triple top formation suggests a bearish scenario with nearest target seen around 1.5420. Immediate resistance is seen around 1.5570. A clear break above that area could trigger further bullish pressure testing 1.5650 region. Potential daily range today is seen between 1.5420 – 1.5570.

gbpusd15-645x370.jpg

USDJPY

The USDJPY didn’t make significant movement yesterday. The bias is neutral in nearest term probably with a little bearish bias testing 123.25. Immediate resistance is seen around 123.75. A clear break above that area could trigger further bullish pressure testing 124.50 area. Potential daily range today is seen between 123.25 – 124.50.

usdjpy16-645x370.jpg
USDCHF

The USDCHF was indecisive last week. The bias is neutral in nearest term probably with a little bearish bias testing 0.9540 support area. Immediate resistance is seen around 0.9650. A clear break above that area could trigger further bullish pressure testing 0.9700 or higher. Potential daily range today is seen between 0.9540 – 0.9650.
 

Attachments

  • usdchf19-645x370.jpg
    usdchf19-645x370.jpg
    38.4 KB · Views: 0
Technical Analysis 31/07/2015

EURUSD
The EURUSD continued its bearish momentum yesterday bottomed at 1.0892 but traded higher earlier today hit 1.0946. The bias remains bearish in nearest term retesting 1.0892. A clear break below that area could trigger further bearish pressure testing 1.0820 key support. Immediate resistance is seen around 1.0950. A clear break above that area could lead price to neutral zone in nearest term testing 1.1000 area. Potential daily range today is seen between 1.0890 – 1.1000. My major technical outlook remains neutral.
eurusd18-645x369_3.jpg

GBPUSD
The GBPUSD was indecisive yesterday formed a Doji on daily chart. The bias is neutral in nearest term probably with a little bullish bias testing 1.5675 area. Immediate support is seen around 1.5540. A clear break below that area could trigger further bearish pressure testing 1.5500 or lower. Potential daily range today remains between 1.5540 – 1.5675. My major technical outlook remains neutral.
gbpusd16-645x369_3.jpg

USDJPY
The USDJPY attempted to push higher yesterday slipped above 124.50 but closed lower at 124.12 and hit 123.91 earlier today. The bias is bearish in nearest term testing 123.00. Immediate resistance is seen around 124.25. A clear break above that area could lead price to neutral zone in nearest term retesting 124.50. Potential daily range today remains between 123.00 – 124.50. My major technical outlook remains neutral.
usdjpy17-645x369_3.jpg

USDCHF
The USDCHF was indecisive yesterday. The bias is neutral in nearest term probably with a little bearish bias testing 0.9600. Immediate resistance is seen around 0.9720. A clear break above that area could trigger further bullish pressure testing 0.9750 – 0.9800 region. Potential daily range today is seen between 0.9600 – 0.9720.
usdchf20-645x369_4.jpg
 
Buying with USD/CHF Trend Is a Wise Bet

A very expensive Swiss Franc has driven Swiss citizens to neighbouring countries for shopping and local consumption has fallen. Economic fundamentals for Switzerland are looking down due the combines crises of Franc appreciate and European deflation, which will be naturally balanced out by a gradually devalued Franc.

This has led Barclays Capital to recommend buying USD/CHF this week, saying it's a macro-technical driven trade.

We think poor Swiss fundamentals continue to support CHF depreciation from still-overvalued levels. Even if concerns about Greece or China escalate, we think the CHF is likely to underperform higher-quality safe havens such as the USD.

Our technical strategist is also bearish CHF and expects further underperformance against the USD and EUR. The rising USDCHF trend of the past eight weeks points higher toward initial targets in the 0.9865/0.9905 area. A move above the latter would encourage our bullish view toward the 1.0130 March recovery high.

- Barclays Capital

10082015_usdchfdaily.png


The uptrend exhibits a steady trend of value-building higher and higher, which suggests that the high is not in yet in USD/CHF. The two swing highs at 1.0130 and 1.0240 therefore make good target for longs in this pair.
 
USD/JPY: Yuan devaluation

An unexpected decision by the People’s Bank of China to devaluate the Yuan by about 1.9% to support the national economy increased market volatility. Gold grew, while oil prices and commodities currencies fell. Nikkei Stock Average closed at 1.6% below.
The USD fall across the market suggests that investors start doubting the chances of the interest rate hike in the US in September. Thus, it is important to watch the Fed’s William Dudley Speech today.
Tomorrow pay attention to the data on Machinery Orders for June in Japan and Retail Sales for July in the US.
The fundamental factors suggest a further growth in the pair.
usd-jpy-yuan-devaluation-12-08-2015.png

Support and resistance
OsMA and Stochastic on the daily chart give buy signals, while on the 4-hour chart they are heading towards the zero line and if cross it successfully, the correction continues.
A breakdown of the level of 123.15 (38.2% Fibonacci) would allow the pair to fall to 122.35 (50% Fibonacci), 121.60 (61.8% Fibonacci). A fall below 120.00 is unlikely.
Support levels: 124.50 (ЕМА50 on the 4-hour chart), 124.10 (23.6% Fibonacci), 124.00 (ЕМА144), 123.80 (ЕМА200), 123.15.
Resistance levels: 124.50, 125.00.
 
Brent: important level of $50 per barrel

Despite the growing USD, Brent crude oil also strengthened today and the price returned to the opening level for the week at $50 per barrel.
Today oil prices received support from the IEA publication, where the agency stated that the prices are growing at their fastest pace for 5 years, after they fell below $50 mark.
Oil prices were also supported by the US EIA release on Wednesday that showed a decrease in crude oil reserves by 1.682 million barrels.
In the medium-term, the main factor affecting the price is going to remain an excess of supply over demand. Oil is going to keep falling and can reach the level of $45 per barrel.
Today, a bunch of news is due from the US, between 3:30 pm and 8 pm (GMT +3), of which the most important is the data on Retail Sales for July.
brent-important-level-of-50-usd-per-barrel.png

Support and resistance
The prices is heading towards year lows at 47.00-45.00.
On the 4-hour chart, OsMA and Stochastic give buy signals, but the further growth is restricted by the resistance levels at 50.50, 50.20 (EMA50). On the daily chart, the indicators remain in the neutral zone.
Support levels: 48.10, 47.00, 46.75.
Resistance levels: 50.20, 50.50, 51.70, 52.50, 53.50, 55.00.
 
EUR/USD: wave analysis

A growth possibility remains. Assumingly, the third wave of the senior level 3 is forming. Locally, the first wave i of 3 in a shape of a diagonal seems to be forming. If the assumption is correct the growth towards 1.1300, 1.1400 continues after a small correction. A critical for this scenario is the level of 1.0840, the breakdown of which would allow the pair to fall to 1.0700.
eur-usd-wave-analysis-17-08-2015.png
I hope this will come towards 1.100 first, then will go towards 1.12800
 
EUR/USD: euro remains under pressure

This week the EUR/USD pair continued moving down amid the recovering demand for the US currency after the Yuan devaluation. During the week, no important macroeconomic publications are expected from the eurozone, thus, the pair dynamics is likely to be determined by US statistics and the situation in Chinese economy and further decline of the Yuan.
On Monday, macroeconomic releases caused a mixed reaction. Thus, positive dynamics in EU Trade Balance (21.9 bln from 21.3 bln euros earlier) failed to support the single currency.
At the same time, negative US statistics were also ignored. NY Fed Empire State manufacturing index dropped from 3.86 to -14.92 against the expected growth to 5.00 points.
eur-usd-euro-remains-under-pressure-18-08-2015.png

Support and resistance
Bollinger Bands on the daily chart continue growing despite the recent downward dynamics. The current decline fits within the “bearish” signal. MACD has turned down and is approaching the zero line. The histogram is below the signal line giving a sell signal. Stochastic is also declining.
The indicators recommend keeping and opening short positions in the short and very short run.

Support levels: 1.1035 (the nearest target), 1.1000 (strong psychological level), 1.0970, 1.0914/00, 1.0865 и 1.0808 (20 July low).
 
Euro Is a Really Boring Currency to Trade

It's been 8 months now, and the world's most liquid currency seems to be driving Forex traders crazy. It's just not moving much, and there haven't been any cues as to what trend it will be following in the near term.
Ever since the ECB started QE, and the Fed has threatened to raise rates, it's been a ping-pong of back and forth trading in EUR/USD, most of the time with seemingly no direction.

Yes, it's not a very exciting trade, but actually a steady range trade can be a lot easier to trade and have more risk-reward than trend-trading, as long as one has patience.

Looking at the long-term daily chart, it's quite clear that the best level to avoid any trading is 1.10, the fair value for the last 8 months, or the price which has traded the most.

Instead, a much safer approach would be placing some pending orders to sell around 1.12 and take profits around 1.10.

19082015_eurusddaily.png
 
Back
Top