fxoday
Recruit
- Messages
- 884
Hello everyone, have a nice day, still opened so many opportunities in the forex market.
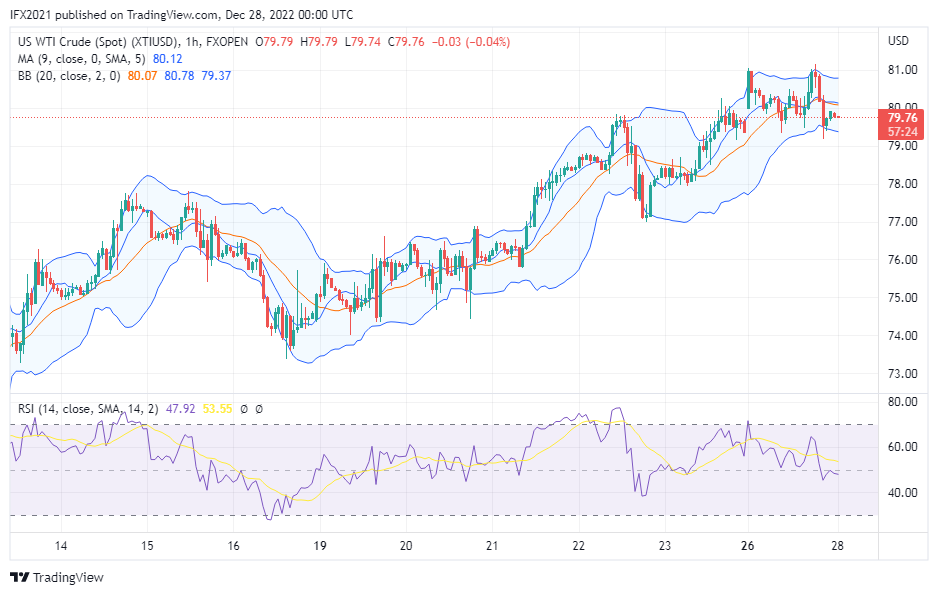
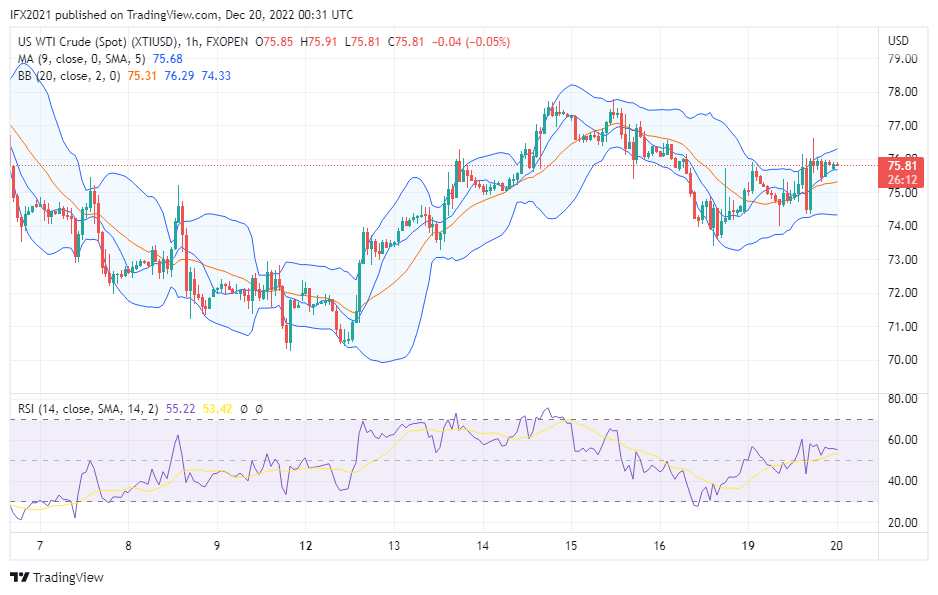
Oil price today traded at 75.81 where the price fell 0.04% from the opening price. The price formed a bulls candle yesterday after a drop to 73.39.
News about Oil citing to the oil price, Russia's response to the oil price cap by G7 declared on December 5, according to spokesman Russian authorities have drafted a decree banning the sale of Russian crude oil to buyers part of the Price Cap Coalition or if the purchase is limited by the G7/EU price cap, as a measure to counter the $60 a barrel price ceiling set by the West.
XTIUSD Technical analysis
The oil price at the time writing is 75.80 where the price rose from a low 73 and formed a bulls candle.
In the daily timeframe we can see Oil prices now move below the middle band line above MA9, here Bollinger band formed descending line indicating a downtrend. While the support zone level is at roughly 70 level price and the resistance level is at 80 level price. RSI indicator shows level 44 above SMA line level 40 indicating a buy signal in a downtrend market.
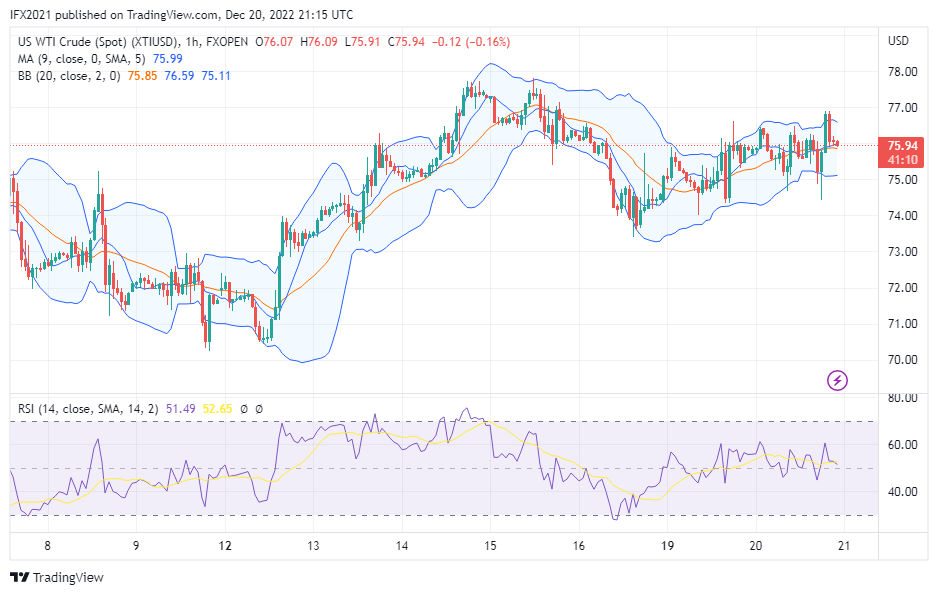
In the hourly timeframe, oil prices now move near MA9 below the upper band line. Here Bollinger band drawing to flat indicating low volatility, while the RSI indicator shows level 54 above the SMA line level 53 indicating an uptrend and buy signal.
FXO Markets Ltd Disclaimer: CFDs are complex instruments and come with a high risk of losing your money.
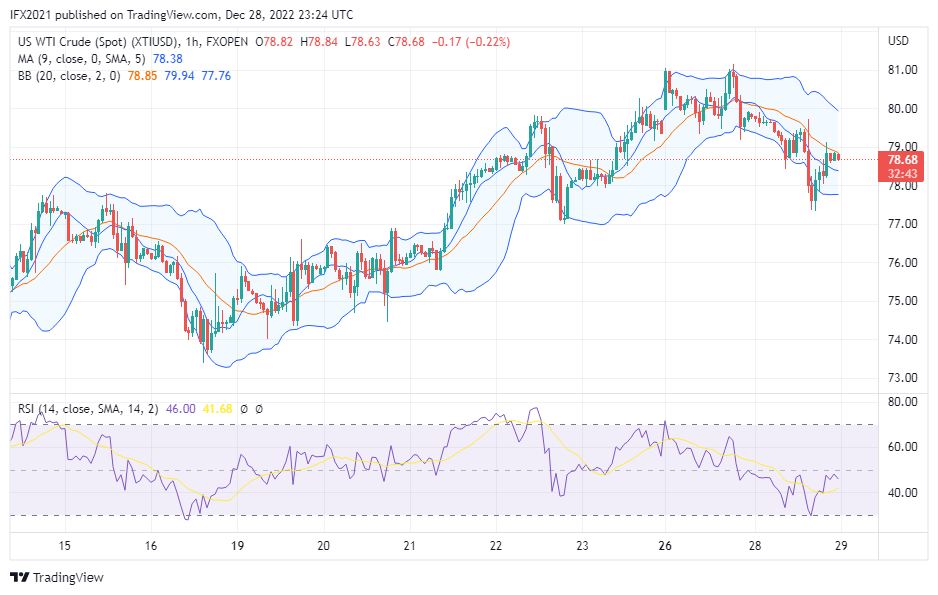
Oil price today traded at 75.81 where the price fell 0.04% from the opening price. The price formed a bulls candle yesterday after a drop to 73.39.
News about Oil citing to the oil price, Russia's response to the oil price cap by G7 declared on December 5, according to spokesman Russian authorities have drafted a decree banning the sale of Russian crude oil to buyers part of the Price Cap Coalition or if the purchase is limited by the G7/EU price cap, as a measure to counter the $60 a barrel price ceiling set by the West.
XTIUSD Technical analysis
The oil price at the time writing is 75.80 where the price rose from a low 73 and formed a bulls candle.
In the daily timeframe we can see Oil prices now move below the middle band line above MA9, here Bollinger band formed descending line indicating a downtrend. While the support zone level is at roughly 70 level price and the resistance level is at 80 level price. RSI indicator shows level 44 above SMA line level 40 indicating a buy signal in a downtrend market.
In the hourly timeframe, oil prices now move near MA9 below the upper band line. Here Bollinger band drawing to flat indicating low volatility, while the RSI indicator shows level 54 above the SMA line level 53 indicating an uptrend and buy signal.
FXO Markets Ltd Disclaimer: CFDs are complex instruments and come with a high risk of losing your money.