XTIUSD price analysis

Hello everyone have a nice day, still much hope in the future so don't lose hope.

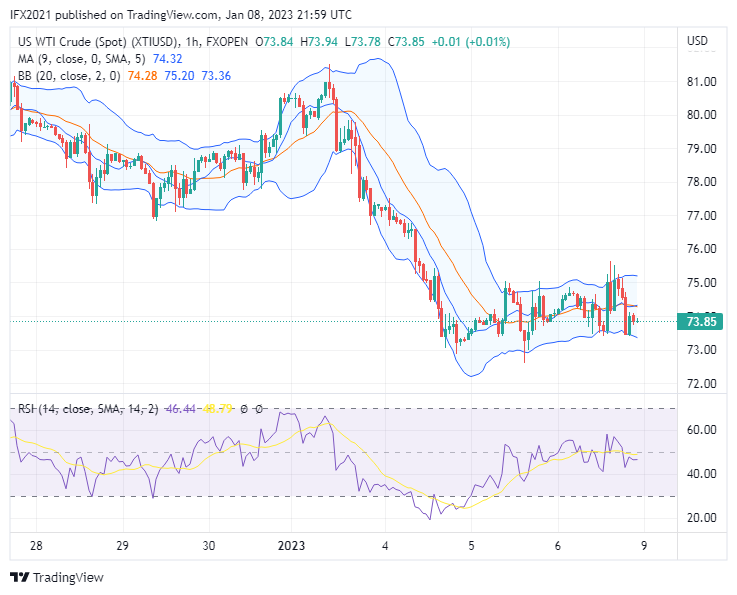
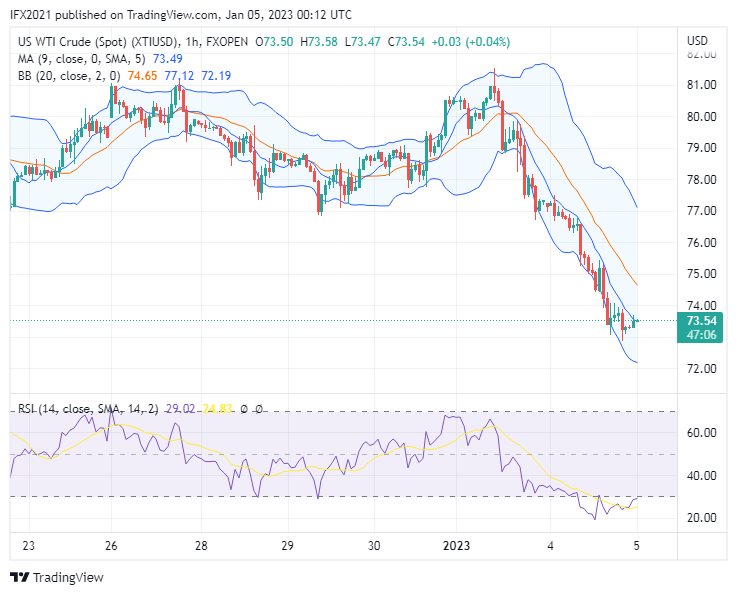
Oil price today again drop to a low of 72.88 based XTIUSD chart FXOpen in Tradingview, the price crossed the middle band line and looks like a new support zone near the lower band line.

Today news citing Oilprice, OPEC’s Oil production rises by 120,000 Bpd in December the reason is Nigerian rebound production.

XTIUSD Technical analysis

Oil price drops to a low of 72.88 as the trend continues. The price now traded at 73.62 at the time of writing. The price move near the lower band line and below the middle band line.

In the daily timeframe, we can see the price now move between the middle band and lower band line which here the middle band line works as the first resistance target level. While the next resistance-based upper band is at roughly 82.60 and the support zone on near 70.74. Bollinger band draws flat or indicates a sideways market while the RSI line shows level 38 indicating a downtrend market.

In the hourly timeframe, we can see the Oil prices now move below the Moving average and middle band line near the lower band line indicating a strong downtrend occurs. In the last few hours, the price tries to retrace and now tries to cross the moving average line. Here Bollinger band draws descending line indicating a downtrend market, while the RSI level shows 29 indicating the price in the oversold zone level.

ulCAMMLl.png


FXO Markets Ltd Disclaimer: CFDs are complex instruments and come with a high risk of losing your money.

 
Hello everyone, have a nice day, the Monday market will begin, and hope this week all traders make a profit.

Oil prices in the last week moved near a low of 73.78, the price not affected by the NFP news release on Friday.

News related to oil today citing to Oilprice, Tesla motor sales slow in China amid falling demand. Tesla delivered 55,796 vehicles for the month, down 44% from November and 21% from the year prior.

XTIUSD technical analysis

XTIUSD price today price is 73.85 based XTIUSD chart FXOpen in Tradingview. The price formed a low of 73.52 and move in the low trading range in the last two days after the decline.

In the daily timeframe, oil prices moved above the lower band and shaped a small body bearish candle. Here Bollinger band draws to flat indicating a sideways market with the possibility swing high near the upper band at 82 and swinging low near the lower band at 69 level prices. RSI level 39 indicates a downtrend in this timeframe.

In the hourly timeframe, we can see the price move sideways between the upper band and lower band, the swing high near 75 and the swing low near 73 level prices. While the RSI indicator shows level 46 indicating a downtrend market.

26IGv8tL.png


FXO Markets Ltd Disclaimer: CFDs are complex instruments and come with a high risk of losing your money.

 
Hello everyone, have a nice day, hope all traders and of members, the FPA community will become profitable.

Oil prices break the 75-level price but traders are still cautious about to decline. Oil price today was 74.81 rebound after hitting a high of 76.88.

News from China citing to Oilprice if these countries signaling to increase in oil demand. China issued a substantial increase in its crude imports quotas for this year, the clearest sign yet that Chinese refiners are set for a material increase in output - and a surge in demand for oil - as the nation finally moves away from its ridiculous Covid Zero policy.

XTIUSD Technical analysis

Oil prices at the time of writing are 74.64 based on the XTIUSD chart FXOpen in Tradingview, oil prices dropped from a high of 76.88 that shaped on 9 January yesterday market.

In the daily timeframe the Oil price move below the middle band line and the moving average that indicating still below the downtrend line. There is decreasing volatility seen on the narrowed Bollinger band line indicator. The resistance target is still near the upper band at 82-level prices and support zone 72-level prices. RSI indicator shows level 43 indicating a downtrend market..

In the hourly timeframe, the oil price moved below the middle band line looking to support near the lower band line at 74.21. There is increasing volatility seen from expanding Bollinger band line, while the RSI level shows 45 indicating price is below the downtrend level.

iwMO7ZjK.png


FXO Markets Ltd Disclaimer: CFDs are complex instruments and come with a high risk of losing your money.
 
Hello everyone, have a nice day, hope all traders getting good profits this week.

Oil price today is 74.67 based XTIUSD chart FXOpen in Tradingview. Oil prices generally still move on the low trading range between 73 to 76 level prices.

An analyst from Oilprice says if oil is steady Fed rate hikes. oil price watchers are looking at U.S. Federal Reserve decisions rather than supply-demand balances, with the community eagerly anticipating Thursday’s inflation data to gauge the extent of upcoming interest rate hikes.

XTIUSD Technical analysis

Oil prices still traded in the low trading range between 73 and 76 level prices on last week's trading days.

In the daily timeframe, we can see Oil price move below the middle band line above the lower band line. Peak level price of oil near the middle band line at 76.47 and support at 72.78. Here Bollinger band draws to a narrow range indicating decreasing volatility occurs in the oil prices. While the RSI level shows 42 which means it is below the bearish level.

Go to the hourly timeframe, oil price now moves crosses down the middle band line and MA line indicating a downtrend market. Here support zone-based lower band at 74.03 and resistance at 76.00. Bollinger band draws a small range indicating low volatility while the RSI indicator shows 45 indicating a downtrend market.


Lm3eHRVY.png


FXO Markets Ltd Disclaimer: CFDs are complex instruments and come with a high risk of losing your money.
 
Hello everyone, have a nice day, hope all traders of the member FPA community obtain good profit this week.

Oil price today rose to 77.78 based XTIUSD chart FXOpen in Tradingview. Oil prices successfully cross the middle band line yesterday.

There is news citing to Oilprice demand rising China's jet fuel ahead of the Lunar Year. This included the reason behind the rising oil prices.

XTIUSD Technical analysis

Oil prices jumped to a high level of 77.98 from a low of 74.06 in yesterday's market.

In the daily timeframe, oil price now crosses up the middle band line and moves above the MA line. The resistance level target is roughly 82 and supports 72.78. Bollinger band indicator draws to narrow indicating decline volatility while the RSI indicator shows 51 which means above the uptrend zone level.

In the hourly timeframe oil price move above the MA line and middle band line indicating an uptrend market. Bollinger band draws to expanding line indicating increasing volatility. While the RSI indicator already shows a value 73 which means in the overbought zone level.

vUxJYJtO.png


FXO Markets Ltd Disclaimer: CFDs are complex instruments and come with a high risk of losing your money.
 
Hello everyone, welcome to this week with new hope from the FX market to make money.

Oil prices still rising and formed a high of 80.44. Oil demand from China seems gives an impact on oil prices as China included the biggest country oil importer.

XTIUSD Technical analysis

Oil price is now 79.84 falling from a high of 80.44 based XTIUSD chart FXOpen in Tradingview. Oil prices recorded a new high in last week's market.

In the daily timeframe Oil price move below the upper band line and above the middle band and moving average, it means is still in an uptrend market based on theoretical analysis. Resistance level oil based upper band near 82 level price and support zone based lower band near 72 level price. Here Bollinger band draws flat indicating a sideways market move on the trading range. While RSI level 56 indicates the price is above the uptrend zone level.

In the hourly timeframe, Oil prices moved near the upper band and rebound after hitting the line. Here we can see the price still move above the middle and moving average which means in the uptrend market, the Bollinger band draws to expand indicating increase volatility, while the RSI level shows 63 indicating the price is above the uptrend zone level.

uEWP5nLn.png


FXO Markets Ltd Disclaimer: CFDs are complex instruments and come with a high risk of losing your money.
 
Hello everyone, have a nice day, I wish all traders will be profitable today.

oil price fails to continue rising yesterday, the price eventually drops again to a low level near 78.80 after hitting a high of 80.40.

Regarding oil prices, Reuters polled many responders who expected the oil prices will be 90 USD per barrel in 2023-2027. China's economic recovery and US's recover give good news for the oil price.

XTIUSD Technical analysis

Oil price now traded at 78.71 based on XTIUSD chart FXOpen in Tradingview, oil price dropped again from a high of 80.40 and now moved near the middle band line.

In the daily timeframe oil price at the previous low and is possible to reverse again. The price now still moves between the upper and middle band line, while the Bollinger band draws flat indicating a sideways market. While the RSI indicator shows level 53 which means above the uptrend zone level.

In the hourly timeframe, oil prices moved near the lower band line which acts as the first support dynamic level. Bollinger band draws descending line indicating a bearish market trying to control in this timeframe, the RSI level shows 39 which means the price is below the downtrend zone level.

If the price continues to drop hence look for new support near 77.69.

A28JOIzK.png


FXO Markets Ltd Disclaimer: CFDs are complex instruments and come with a high risk of losing your money.
 
Hello everyone, have a nice day. In life does not always suits expectation, don't despair and never lose hope. Life remains worthy to continue.

Oil price today is 79.40, not too much difference compared to yesterday's low. News rising oil demand from China still has not yet lifted oil prices. IEA also sees global oil demand rising in 2023. But the price is still below the 80-level price.

XTIUSD Technical analysis

Oil price yesterday formed a high of 82.64 and a low of 79.21 based XTIUSD chart FXOpen in Tradingview.

In the daily timeframe Oil price move above the middle band line and moving average indicating an uptrend market. Bollinger band also draws flat indicating the price probably moves in the trading range swinging high 83 and swinging low 69 level prices. RSI indicator shows a level uptrend above 53.

In the hourly timeframe oil price move near the lower band, here Bollinger band draws to expand indicating increased volatility. While RSI indicator shows level 32 indicating the price in a downtrend market already move near the oversold zone level

Candlestick pattern at time writing still formed bearish candle possibly continue decline looking new low.

RlvzFHIA.png


FXO Markets Ltd Disclaimer: CFDs are complex instruments and come with a high risk of losing your money.
 
Hello everyone, have a nice day, wish all traders in the FPA forum community becomes getting success in life.

Oil price rise to 80.80 based XTIUSD chart FXOpen in Tradingview. An analyst from Oilprice said the oil company started 2023 with less debt than the previous year and Windfall taxes could make energy companies less profitable in 2023.

XTIUSD Technical analysis

Oil price rise today to above 80 level price after the previous low 79 level prices.

In the daily timeframe Oil price move between the upper and middle band line. The price is above the moving average indicating the prices are still above the bullish trend market. Here Bollinger band still draws ascending line with a similar wide indicating not increasing volatility. While the RSI indicator shows level 57 which means the price is above the uptrend zone level.

Oil price in the hourly timeframe, the price now moves near the upper band line, here Bollinger band draws to expand indicating increasing volatility and the price tries to break the upper band line. The RSI indicator shows level 65 which means the price is above the uptrend zone level near the overbought zone level.

cDeOG8SE.png


FXO Markets Ltd Disclaimer: CFDs are complex instruments and come with a high risk of losing your money.
 
Hello everyone, have a nice day, Monday market was starting, and the market gives us chances for traders to make money again.

Oil price is now 81.44 at the time of writing based XTIUSD chart FXOpen in Tradingview. the price movement in the last week is still in the trading range.

News related oil citing to oilprice, amidst Rusian price cap, Bulgarian remains major buyer Russian oil.

XTIUSD Technical analysis

Oil prices traded at roughly 81 dollars per barrel. In the daily timeframe oil price move below the upper band line which the line acts as a dynamic resistance. in the last few days market the oil prices traded near the middle band and upper band line indicating a price range of roughly 78 and high 81 level prices. Bollinger band draws flat but formed ascending line indicates weak uptrend market. while RSI shows level 57 which means the price is above the uptrend zone level.

In the hourly timeframe, the oil price is now 81.27 trying to cross the moving average from the top. Here moving average still trying to reject but still possible the price cross down the line and looking support 80.39. Bollinger band draws to expand there is an indication increase volatility. while the RSI indicator shows 53 which means the price is still above the uptrend zone level, but the line arrows to down.

es1OshM4.png


FXO Markets Ltd Disclaimer: CFDs are complex instruments and come with a high risk of losing your money.
 
Back
Top