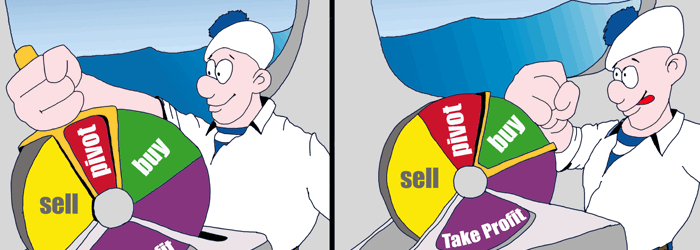
Forex Pivot Point Strategy
Trading pivot point strategy has been popular for intraday traders for a long time now. Same rules for using this strategy as in most other support/resistance strategies. However, there is a difference as the important support/resistance levels called pivot points are calculated using daily high, low and close. Therefore, they are fixed for the whole day and can help you plan potential areas of interest in advance.
What Is A Pivot Point?
Pivot point is another technical analysis indicator that most trading platforms offer. It is based on the previous day’s average of high, low and close. Therefore, when the price moves above this level the next day, we can assume the market direction is bullish or vice versa when the price trades below this level.
In addition to the main pivot point, there are usually at least 4 more levels called: S1, S2, R1, and R2. They indicate further support and resistance levels for the day and can be used to set a target for profit-taking, trade entry or stop loss. These levels can also be used to look for market reversals or continuations in the same way as regular price action support/resistance levels.
The main difference, when compared to other indicators, is that the levels remain static throughout the day. This allows for planning potential trading opportunities for the day. Furthermore, long-term traders can use weekly or even monthly pivot point calculation to plan potential support/resistance levels a long time in advance.
How To Calculate Pivot Points?
As mentioned before, the pivot point is calculated based on the average price of previous day’s high, low and close. Therefore, the formula is following:
Pivot Point (P) = (High + Low + Close) / 3
Following first support/resistance levels are then calculated based on the pivot point and either high or low os the daily price:
First Resistance (R1) = (2xP) – Low
First Support (S1) = (2xP) – High
After this, the second level of support/resistance levels are calculated as follows:
Second Resistance (R2) = P + (High – Low)
Second Support (S2) = P – (High – Low)
Other methods of pivot point calculation exist, however, they are not frequently used and likely will not be found on your trading software. Read more on this here.
How To Use Pivot Points?
Pivot points are usually used in the same way as regular support/resistance levels. They indicate potential areas of interest and can be used to set profit targets, stop losses, etc. Since they remain static for the whole trading day after previous day closes and new pivot points are recalculated, this allows for easy trade planning.
A simple example of how to use pivot points would be to buy the market once it starts trading above the central pivot with the expectation that the first resistance (R1) will be reached and, therefore, can be used as a profit target. This is because these indicators imply that the market will follow trading either above or below the central pivot. Therefore, trading against this rule of thumb is not advisable.
Additionally, pivot points can be used together with other indicators. Moving averages and momentum oscillators can be a great combination when using pivot points for addition confluence. Furthermore, regular support and resistance levels still impact the price moves, therefore, they should not be forgotten. Most popular trading platforms offer a pivot point indicator, therefore, combining them is a quick and easy process.
Timeframes And Pivot Points
Usually, pivot points are established on a higher timeframe than the one you are trading. This means that a trader that used 4-hour charts should look to use daily pivot points and a daily time-frame trader should use weekly pivot points. This allows for more accurate potential support/resistance levels, however, using the pivot point of the same timeframe can also be used for a more aggressive approach.
Read further on how to use multiple time frames here.
Example Of Pivot Point Strategy – London Session Open.
A common strategy among traders who use pivot points is the trade entry based on the London session`s open. London session opens at 8 am GMT and is important because it’s the time that big banks and traders start their operations.
Therefore, after the first 15 minutes have passed, a position is taken based on whether the price is above or below the central pivot point. If the market trades below the central pivot – a short position is taken with the target of S1. Alternatively, if the market trades above the central pivot – a long position is taken with the expectation that R1 will be reached. However, if the price has already moved too far away towards ether the next support or resistance, it is best to stay away from the trade as the potential risk/reward is not worth it.
Once the respective position is taken, a stop-loss is placed either slightly above or below the central pivot to protect yourself from losses in the case that market momentum has shifted. Further, a profit target is established either as S1 or R1, depending on whether a short or long position is taken respectively. Additionally, you can use partial profit-taking at the first support/resistance and leave open rest of the position until the next support/resistance level is reached as S2 or R2 respectively.
Key takeaways:
- Pivot points are calculated based on the average price of previous days/weeks/months high, low and close, however, other methods can also be used.
- They offer static levels of support/resistance, therefore, allowing to plan trading in advance.
- They are traded the same way that regular support/resistance levels, however, are not subjective as they are calculated using a formula.
- Based on whether the market is trading above or below the central pivot point, the market sentiment can be determined for the respective period.
- Using additional technical analysis tools such as moving averages, regular support/resistance levels, trend lines as well as momentum indicators can further help to establish market sentiment and levels of confluence.
Author Profile

Fat Finger
My name is Phat Fin Ge, but most people just call me Fat Finger or Mr. Finger.
Many years ago, I was a trader on the Hong Kong Stock Exchange. I became so successful that my company moved me to their offices on Wall Street. The bull market was strong, but my trading gains always outperformed market averages, until that fateful day.
On October 28th, 1929, I tried to take some profits after Charles Whitney had propped up the prices of US Steel. I was trying to sell 10,000 shares, but my fat finger pressed an extra key twice. My sell order ended up being for 1,290,000 shares. Before I could tell anyone it was an error, everyone panicked and the whole market starting heading down. The next day was the biggest stock market crash ever. In early 1930, I was banned from trading for 85 years.
I went back to Hong Kong to work at my family's goldfish store. Please come and visit us at Phat Goldfish in Kowloon, only a 3 minute walk from the C2 MTR entrance.
I thought everyone would forget about me and planned to quietly return to trading in 2015. To my horror, any error in quantity or price which cause a problem kept getting blamed on Fat Finger, even when it was a mix up and not an extra key being pressed. For example, an error by a seller on the Tokyo Stock Exchange was to sell 610,000 shares at ¥6 instead of 6 shares at ¥610,000. That had nothing to do with me or with how fat the trader's finger was, but everyone kept yelling, "Fat Finger! Fat Finger!" In 2016, people blamed a fat finger for a 6% drop in the GBP. It really was a combination of many things, none to do with me or anyone else who had a wider than average finger.
Now that I can trade again, I'm finding forex more interesting than stocks. I've been doing some research on trading forex and other instruments and I'll be sharing it here.
If you see any typing errors, you can blame those on my fat finmgert. If you see any strange changes in price, it's not my fault.
Info
859 Views 0 CommentsTags
forex strategyComments
Table of Contents
Recent
-
Bitcoin Fundamental Briefing, March 2024 Demystifying Cryptocurrency Nodes: Deep Dive into Polygon Node Ecosystem Strategies for Trading Forex on a Budget Bitcoin Fundamental Briefing, February 2024 Bitcoin Fundamental Briefing, January 2024 Strategic Asset Allocation Techniques for Currency Traders Bitcoin Fundamental Briefing, December 2023 Bitcoin Fundamental Briefing, November 2023