Forex Candlestick Patterns for Beginners – Price Action Trading Guide
Using our beginner’s guide to forex candlestick patterns, learn the most popular setups and whether they signal a potential bullish or bearish market move
If you’re a price action trader, then forex candlestick patterns need to be a part of your trading strategy.
Forex candlestick patterns offer a real-time glimpse into whether the bulls or bears are taking charge of a market and therefore allows you to make an informed trading decision.
When used in conjunction with trends and simple support/resistance levels, forex candlestick patterns become one of the simplest and most powerful analysis tools available.
In this beginner’s guide, we go over the basics of a Japanese candlestick, highlight the most popular single, two-candle and three-candle chart patterns, and show you how to trade them.
The Japanese Candlestick
A Japanese candlestick displays all the price information of a forex market’s movement, within a specific time frame.
Candlesticks have become the most popular method of displaying price on a chart and are widely used to help traders conduct technical analysis on a market.
They give traders all the information you need to quickly and easily digest how price has moved over time.
Japanese Candlesticks Explained
Let’s first take a look at the anatomy of a Japanese candlestick.
Keep in mind that each candlestick contains price action within a set period of time, depending on which timeframe chart you’re viewing.
For example, an M15 chart will display fifteen minutes of price action within each candle, while a D1 chart will display an entire day’s price action within each candle.
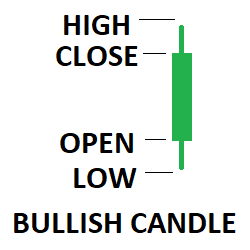
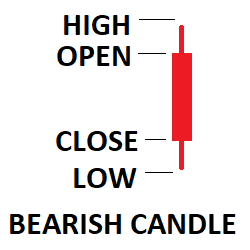
Body: The trading range between the candle’s opening and closing price.
Wick: The candle’s high and low price.
Color: The direction price moved between the candle’s opening and closing price.
Popular Candlestick Patterns
Now we understand how to read a Japanese candlestick chart, it’s time to take a look at the most popular forex candlestick patterns.
Each pattern has a bullish and bearish variant to them, made up of the direct opposite price action and therefore indicates a move in opposite directions.
We’ve broken these down into single, two-candle and three-candle chart patterns and show you whether they indicate a price reversal, continuation or indecision.
Single Candle Patterns
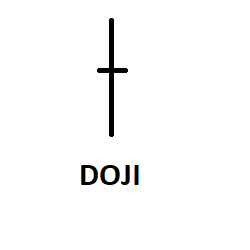
A doji is a neutral single candle pattern, that indicates indecision between the bulls and bears.
It features little movement up or down and price returns to close back on the same price that it opened.
It shows that the bulls and bears were both fighting equally for control of the market and there was no clear winner at the end.
Many traders misinterpret a doji as a reversal candle, but all it shows is indecision and should instead be viewed as neutral.
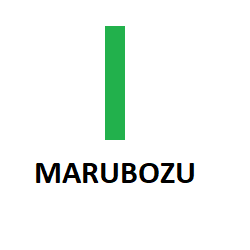
A marubozu is a candle that indicates one side is in total control of the market at this particular time.
It features a candle that’s all body and has no wicks on either size.
This means that price opened, instantly traded in the one direction and then closed at the other extreme.
By looking at which colour the body of the marubozu candle closes, you can see who remains in charge.
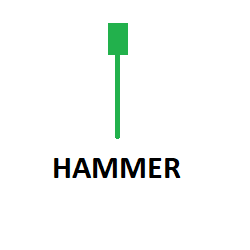
A hammer is a bullish reversal pattern that is often formed at the bottom of a bearish trend.
Picture the candle’s wick as the handle and the body as the hammer’s head.
When price is in a bearish trend, a hammer signals a potential bottom may be in.
The long bottom wick shows that the bears pushed price lower, but the bulls fought back and were in control when the candle closed.
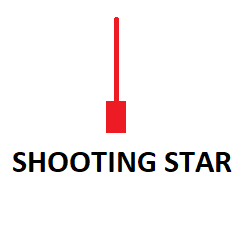
A shooting star is a bearish reversal pattern that is often formed at the top of a bullish trend.
Think of the candle’s wick as the light trail a shooting star leaves in the sky as it’s burnt up entering the Earth’s atmosphere, while the body is the burning meteor itself.
When price is in a bullish trend, a shooting star signals a potential top may be in.
The long upper wick shows that the bulls pushed price higher, but the bears fought back and were in control when the candle closed.
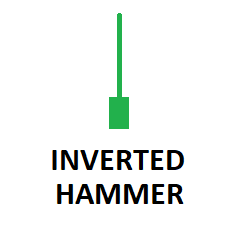
An inverted hammer is a bullish reversal pattern, also often formed at the bottom of a bearish trend.
As the name suggests, it looks the same as the hammer pattern we described above with the handle and metal head, but just upside-down.
When price is in a bearish trend, an inverted hammer also suggests that the bottom may be in.
Although the long wick is pointing to the upside, it still showed that the bulls were in charge when the candle closed, indicating that the sell orders may have all been accumulated.
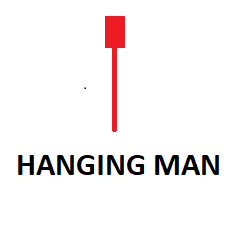
A hanging man is a bearish reversal pattern, often indicating a top within a bullish trend.
We’ll leave you try and picture where this candlestick gets its particular name.
When price is in a bullish trend, a hanging man indicates that price may be nearing the top of this recent swing.
The long wick points to the downside, but the candle forms with its body as the potential top.
While it looks the same as a hammer, it’s formed at a different part of the trend and means something entirely different.
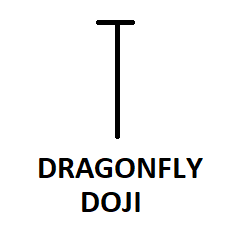
A dragonfly doji is a bullish reversal pattern that is often formed at the bottom of a bearish trend.
Does that candle shape make you think of a thin, gangly dragonfly buzzing through the air?
They show a potential bottom may be forming at the end of a bearish trend.
While classic doji candles represent no clear winner between bulls and bears, the long lower wick is the most important part of the dragonfly doji as it signals the bulls are actually the ones in charge.
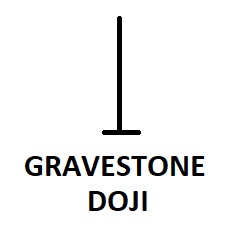
A gravestone doji is a bearish reversal pattern that can usually be found at the top of a bullish trend.
Picture a gravestone rising out of the ground and you’ll soon figure out where the candle received its name.
This candlestick pattern shows a potential top forming at the end of a bullish trend.
The long wick to the upside shows the bulls, who had been in charge of the trend, now having lost control.
With the candle closing right back at its open and lowest point, the bears seem to have soaked up all of the demand.
Two Candle Patterns
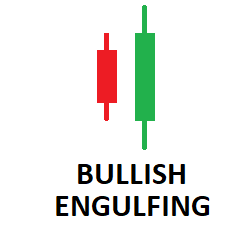
A bullish engulfing pattern features two-candles and often forms at the bottom of a bearish trend.
This two-candle pattern is made up of a smaller bearish candle, immediately followed by a larger bullish candle that seems to engulfs it.
When price is in a bearish trend, a bullish engulfing candle can signal that a bottom may have been printed.
This is because the bulls have shown that they’re now in charge of the market after swamping the bears who were shown to be running out of power with that small bearish candle.
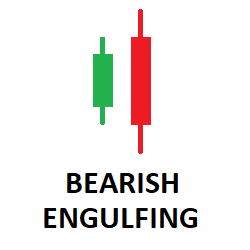
A bearish engulfing pattern features two candles, usually found at the top of a bullish trend.
This is another two-candle pattern that is made up of a smaller bullish candle that is then immediately followed by a larger bearish candle that engulfs it.
If price is in a bullish trend, then a bearish engulfing pattern can be a sign that this is the top of the trend.
This candlestick pattern shows when the bulls were running out of power, the bears completely swamped them and took control of the market.
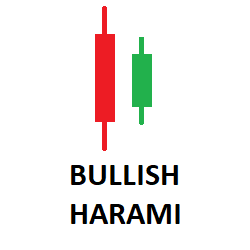
A bullish harami is a bullish reversal pattern that can usually be found at the bottom of a bearish trend.
This particular pattern features a larger bearish candle and is followed by a smaller bullish candle that has gapped up before starting to form.
As the forex markets feature less gaps than equities, this pattern is less prominent and worth less of your time analysing as a result.
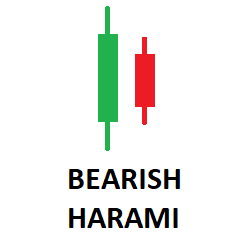
A bearish harami is a bearish reversal pattern that is most useful when found at the top of a bullish trend.
It features a larger bullish candle, followed by a smaller bearish candle that also gapped down before still closing within.
The gap required to make this pattern a reality, once again won’t be found very often on the more liquid forex markets such as the majors.
Focus your attention on other forex candlestick chart patterns.
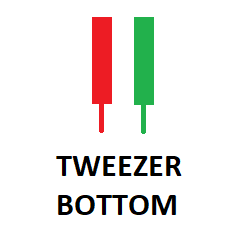
A tweezer bottom is a bullish reversal pattern that’s usually used to indicate the end of a bearish trend.
With two candles featuring lower wicks that each touch the same price, the naming of this chart pattern is fairly obvious.
The most important part of the tweezer bottom pattern is that the two wicks touch the same price and are of somewhat equal length.
For optimal results, also look out for the first candlestick’s body being bullish, while the second closes bearish.
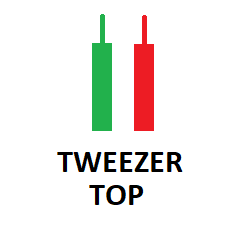
A tweezer top is a bearish reversal pattern that on the other hand, is used to indicate the end of a bullish trend.
The two candles feature upper wicks that touch the same price just like a pair of tweezers facing into the sky and ready to pluck that pesky eyebrow hair!
Again, the most important part of the tweezer top pattern is that the two wicks touch the same price and should be of equal length.
The first candle body should also be bearish, while the second closes bullish.
But as we know, nothing in trading is textbook so just focus on the two wicks tapping that important price level.
Three Candle Patterns
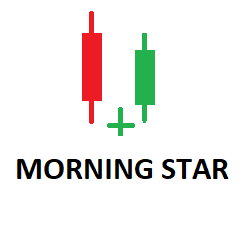
A morning star is a three-candle pattern that signals a bullish reversal when it forms at the end of a bearish trend.
It gets its name from price rising off its lows like the first morning star rising from the horizon.
The first candle is a bearish candle, often forming at the end of a prolonged bearish trend.
This is followed by a doji and finally a bullish candle that closes above the midpoint of candle one.
A morning star shows a change-over of control from the bears to the bulls.
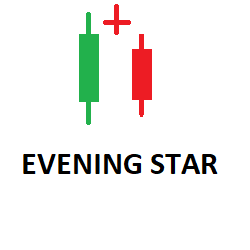
An evening star is a three-candle pattern that signals a bearish reversal when it forms at the end of a bullish trend.
It gets its name because it resembles a star already high in the sky as time moves later into the evening.
As a mirror image of the morning star, an evening star consists of a bullish candle, a doji and lastly a bearish candle that closes below the midpoint of candle one.
It’s a visual representation of control shifting from the bulls to the bears.
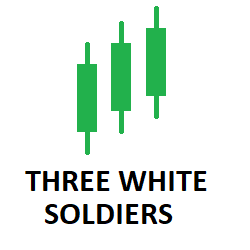
A three white soldiers candlestick pattern is a bullish formation featuring three long bullish candles.
Unlike the other reversal patterns, the three white soldiers aren’t an indication that price is going to reverse, but rather confirmation that the reversal has occurred.
For this pattern to be valid, each bullish candle must be larger than the previous and have minimal upper wick.
As this is a confirmation signal, the bulls must be shown to be clearly in charge of the market.
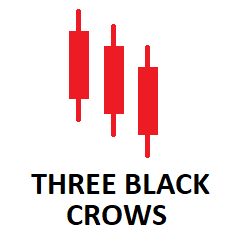
A three black crows candlestick pattern is the same formation, but in a bearish market position.
The pattern gets its name because traditionally, black crows are bad luck.
It’s also a confirmation pattern of a reversal, that price has formed a top and that the bears have now taken control.
It consists of three bearish candles in a row, each larger than the previous and featuring little to no lower wick.
It shows that the bears have taken control of price.
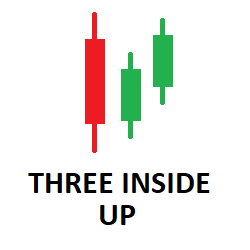
A three inside up is another candlestick pattern that signals a bullish reversal, when formed at the end of a bearish trend.
Its name comes from the fact that there are three candles, the second and third rising from inside the first bearish candle.
When this pattern forms at the end of a down trend, it shows that the bears have lost control and a trend reversal may be on the cards.
For a textbook definition, the first candle must have a long bearish body, the second candle must make it to at least the mid-point of the first candle and the third candle must close above the first candle’s high.
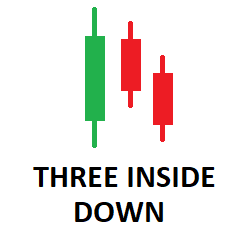
A three inside down candle is once again the same pattern, but signaling a bearish reversal at the end of a bullish trend.
If the first derived its name from the fact the final candle was rising, then you can guess that this one gets its name from the fact that price is falling out of a bullish candle.
When this pattern forms at the end of a bullish trend, it shows that the bulls have lost the control they once had on the market and a reversal could be here.
See the definition of the three inside up pattern and just flip it upside-down.
Trading Forex Candlestick Patterns
Now that you’re aware of the most popular forex candlestick patterns, unfortunately you can’t just blindly enter trades whenever you see them form.
This is a surefire recipe for a margin call on your account.
There are two main things that you need to be aware of before you enter a trade on the back of a forex candlestick pattern.
The Preceding Trend
The trend really is your friend right up until the end.
Did you notice that most of these forex candlestick patterns are best used in a particular market direction?
A bearish reversal pattern should be used to indicate the end of a bullish trend.
A bullish reversal pattern should be used to indicate the end of a bearish trend.
If you blindly enter a trade within the wrong trend direction, the candlestick pattern won’t mean much at all.
For best results, always pay attention to the preceding trend.
Support/Resistance Levels
As a price action trader, support and resistance levels should be at the foundation of any technical analysis you conduct.
If you combine support/resistance levels with forex candlestick patterns that signal reversals at the end of trends, then you have a lot of things pointing toward a successful trade.
Trading forex is all about putting the odds in your favour and by lining all of your ducks in a row, you can give yourself the best chance of success.
Trading forex is all about achieving consistency and always giving yourself the highest odds of being profitable.
Final Thoughts on Forex Candlestick Patterns
This trading guide has given beginner traders a glimpse into the world of forex candlestick patterns and what it means to be a price action trader.
When candlestick patterns are used alongside trends and support/resistance levels, they become a powerful, forward looking market analysis method.
When you look at a chart, you’re now going to see forex candlestick patterns everywhere.
But the best traders are the ones that are able to identify which setups have the best probability of delivering a profitable outcome.
Author Profile

Fat Finger
My name is Phat Fin Ge, but most people just call me Fat Finger or Mr. Finger.
Many years ago, I was a trader on the Hong Kong Stock Exchange. I became so successful that my company moved me to their offices on Wall Street. The bull market was strong, but my trading gains always outperformed market averages, until that fateful day.
On October 28th, 1929, I tried to take some profits after Charles Whitney had propped up the prices of US Steel. I was trying to sell 10,000 shares, but my fat finger pressed an extra key twice. My sell order ended up being for 1,290,000 shares. Before I could tell anyone it was an error, everyone panicked and the whole market starting heading down. The next day was the biggest stock market crash ever. In early 1930, I was banned from trading for 85 years.
I went back to Hong Kong to work at my family's goldfish store. Please come and visit us at Phat Goldfish in Kowloon, only a 3 minute walk from the C2 MTR entrance.
I thought everyone would forget about me and planned to quietly return to trading in 2015. To my horror, any error in quantity or price which cause a problem kept getting blamed on Fat Finger, even when it was a mix up and not an extra key being pressed. For example, an error by a seller on the Tokyo Stock Exchange was to sell 610,000 shares at ¥6 instead of 6 shares at ¥610,000. That had nothing to do with me or with how fat the trader's finger was, but everyone kept yelling, "Fat Finger! Fat Finger!" In 2016, people blamed a fat finger for a 6% drop in the GBP. It really was a combination of many things, none to do with me or anyone else who had a wider than average finger.
Now that I can trade again, I'm finding forex more interesting than stocks. I've been doing some research on trading forex and other instruments and I'll be sharing it here.
If you see any typing errors, you can blame those on my fat finmgert. If you see any strange changes in price, it's not my fault.
Info
1935 Views 0 CommentsTags
candlestick patternsComments
Table of Contents
Recent
-
Bitcoin Fundamental Briefing, March 2024 Demystifying Cryptocurrency Nodes: Deep Dive into Polygon Node Ecosystem Strategies for Trading Forex on a Budget Bitcoin Fundamental Briefing, February 2024 Bitcoin Fundamental Briefing, January 2024 Strategic Asset Allocation Techniques for Currency Traders Bitcoin Fundamental Briefing, December 2023 Bitcoin Fundamental Briefing, November 2023