SOLID ECN LLC
Solid ECN Representative
- Messages
- 516
Bearish Signs for NZD/USD
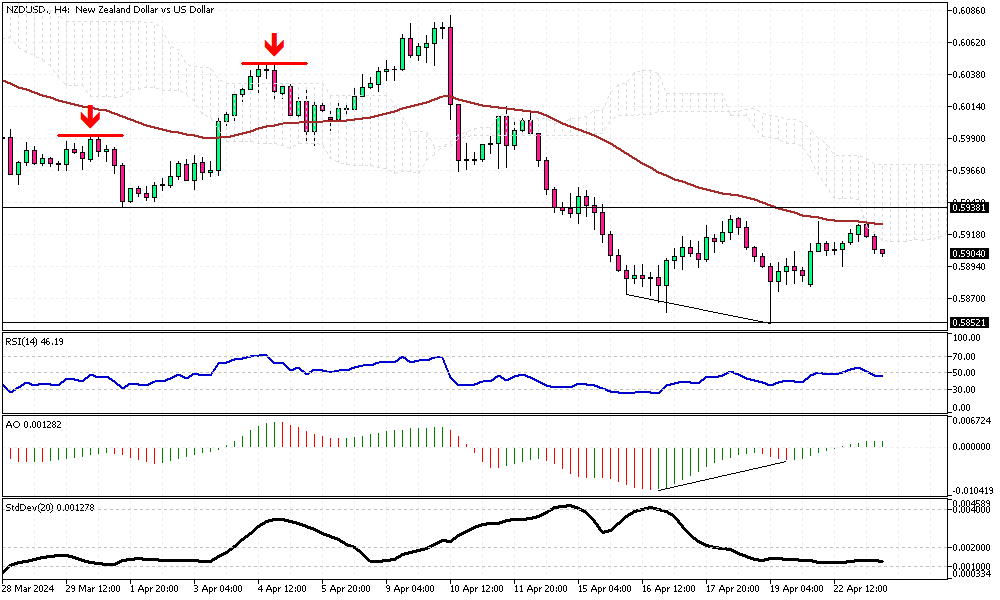
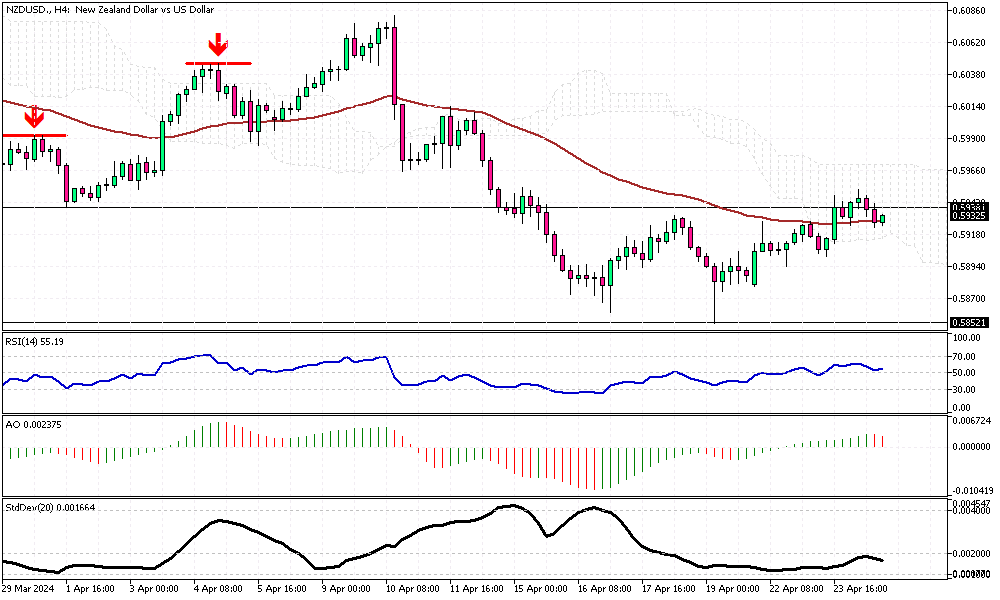
Solid ECN—The New Zealand dollar traded below the Ichimoku Cloud and the 50 EMA against the U.S. Dollar, sitting at around 0.59 during Tuesday's U.K. trading session.
The technical indicators give mixed signals, but they have a more bearish than bullish outlook. The Relative Strength Index hovers below the 50 level, but Awesome Oscillator bars are green and hovering above the signal level. It is worth noting that the AO indicator signals divergence in its bars, which can be interpreted as either a consolidation phase or a potential trend reversal on the horizon. Therefore, traders and investors should approach the NZD/USD market with caution.
From a technical standpoint, the primary trend is bearish as long as the pair stays below the 0.5938 resistance level, as depicted in the 4-hour chart above. In this scenario, the downtrend will likely resume, and the initial target would be to test April's low at the 0.5852 support level.
Conversely, the bearish outlook is invalidated if the NZD/USD price crosses and stabilizes above the 0.5938 mark.