2023 Market Forecast by Solid ECN

SOLID ECN LLC

Solid ECN Representative
Messages
514
EURUSD Gets New Positive Signal

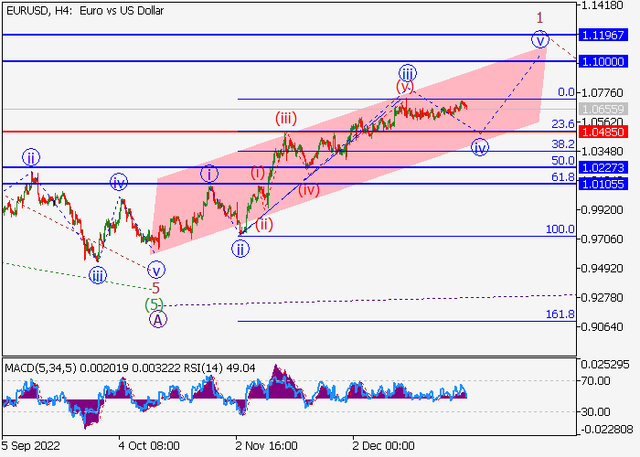
The EURUSD pair leaned on the EMA50 and begins to provide slight positive trades by today’s open, noticing that stochastic overlaps positively now, waiting to motivate the price to resume the expected bullish trend for the upcoming period, which its targets begin by testing 1.0745, noting that breaching this level will extend the bullish wave to reach 1.0840 areas.

eurusd.png


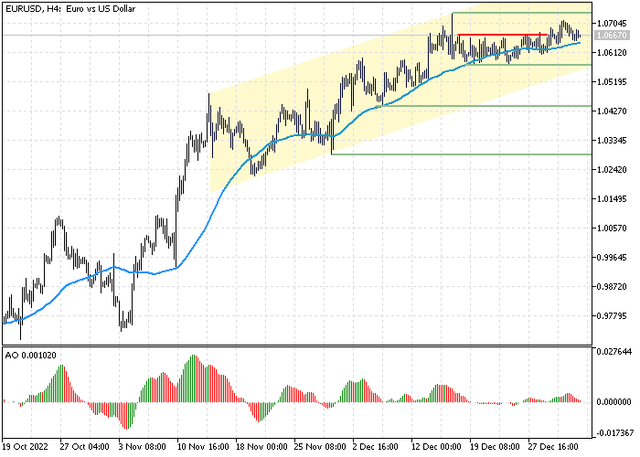
Therefore, the bullish trend scenario will remain valid and active, noting that breaking 1.0640 might press on the price to provide intraday negative trades that target testing 1.0515 areas before any new attempt to rise.

The expected trading range for today is between 1.06 support and 1.0760 resistance.​
 
GBPUSD Within Sideways Track

The GBPUSD pair fluctuates within sideways track recently as appears on the chart, and the EMA50 continues to press negatively on the price, to keep the correctional bearish trend active, waiting to visit 1.1950 mainly.

gbpusd.png


On the other hand, we should note that breaching 1.2135 will stop the expected decline and lead the price to regain the main bullish trend again and head to achieve gains that start by visiting 1.2235 areas.

The expected trading range for today is between 1.1980 support and 1.2150 resistance.​
 
USDJPY Resumes the Main Bearish Track

The USDJPY pair faced strong negative pressures in the previous sessions to return to the main bearish channel, and begins today with additional decline to break 130.00 barrier and open the way to continue the bearish bias on the intraday and short term basis, making the bearish trend dominant in the upcoming sessions, and we expect to target 128.90 followed by 127.85 levels as next main stations.

usdjpy.png


The EMA50 supports the expected decline, which will remain valid unless breaching 130.55 and holding above it, as breaching this level might push the price to test 132.35 areas initially before any new negative attempt.

The expected trading range for today is between 128.60 support and 130.50 resistance​
 

USDCAD Begins Negatively

The USDCAD pair found solid resistance around 1.3600, to rebound downwards strongly now, on its way to turn to decline and head to achieve negative targets that start by testing 1.3500 and extend to 1.3405 after breaking the previous level.

usdcad.png


Therefore, we expect to witness more bearish bias today supported by the negative signals provide by stochastic, taking into consideration that breaching 1.3620 will stop the current negative pressure and push the price to 1.3680 initially.

The expected trading range for today is between 1.3460 support and 1.3600 resistance.​
 
Gold Technical Analysis

Gold price faces negative pressure now, to head towards potential test to the key support 1824.50, affected by stochastic negativity, while the EMA50 continues to provide the positive support to the price, to keep the bullish trend scenario valid conditioned by the price stability above the mentioned support and the most important above 1812.25, reminding you that our waited targets begin at 1850 and extend to 1900.

gold.png


The expected trading range for today is between 1830 support and 1865 resistance.​
 
EURUSD - The possibility of growth remains.

On the daily chart, the downward wave of the higher level A has completed, in which the fifth wave (5) of A has appeared and the upward wave B is developing. At the moment, the construction of the first wave 1 of (A) of B continues, in which the third wave of the lower level iii of 1 has formed and the development of a local correction as the fourth wave iv of 1 is observed.

If the assumption is correct, the EURUSD pair will rise to the area of 1.1 – 1.1196. The level of 1.0485 is critical and stop-loss for this scenario.

eurusd.png
 

GBPJPY Under the Negative Pressure​

The GBPJPY pair ended yesterday by touching 155.35 level, to approach the previously waited target followed by bouncing temporarily towards 157, noting that the bearish track will remain valid depending on 158.70 level forming additional barrier, to expect gathering the additional negative momentum by reaching 155 level followed by attempting to press on the historical support at 154.55.

gbpjpy.png


Any attempt to rally above the mentioned barrier might lead to postpone the negative attack and start the correctional bullish track again, to target 160 as a first correctional station. The expected trading range for today is between 157.6 and 154.6.​
 

USDCHF - The possibility of growth remains.​

On the daily chart, the third wave of the higher level 3 is developing, in which the ascending first wave (1) of 3 appeared and the downward correction ended as the second wave (2) of 3. At the moment, wave C of (2) has ended and wave (3) of 3 is developing.

If the assumption is correct, the upward dynamics of the USDCHF pair will continue to the area of 0.9900 – 1.0151. The level of 0.9195 is critical and stop-loss for this scenario.

usdchf.png
 

EURJPY Takes Breath

The EURJPY pair started to form intraday sideways trades by consolidating near 138.2 level, attempting to take a breath after suffering additional losses yesterday and touching 137.40 target.

eurjpy.png


We remind you that forming continuous barrier at 138.8 and getting negative momentum by the major indicators will reinforce the domination of the bearish bias for the upcoming period, to keep waiting to resume the negative attack and attempt to reach 136.55 that forms the next target for the negative trades.

The expected trading range for today is between 138.80 and 137.​
 
ETHUSD - Technical analysis

This week, the price has attempted to grow and is currently actively testing the level of 1250 (Murray level [2/8]), consolidation above which will allow the cryptocurrency to return to the mark of 1325 and try to leave the long-term descending channel to rise to the area of 1500 (Murray level [4/8]). Otherwise, the downward dynamics will increase to the levels of 1090, 1000 (Murray level [0/8]) and 875 (Murray level [-1/8]).

eth.png


Technical indicators allow for the resumption of a smooth decline: the Bollinger Bands are reversing downwards, the MACD histogram is stable in the negative zone, and the Stochastic is approaching the overbought zone, which can become a catalyst for the reversal of the trading instrument down.

Resistance levels: 1250, 1325, 1500 | Support levels: 1090, 1000, 875​
 
Back
Top