2023 Market Forecast by Solid ECN

BTCUSD - Growth may not last long

Experts attribute the positive dynamics of the asset to the market reaction to the publication of December data from the US labor market, which reflected signs of a decrease in inflation pressure on the national economy: the growth of average hourly wages slowed down from 0.4% to 0.3% MoM, and from 4.8% to 4.6% YoY, reinforcing investors' hopes for a slowdown in the tightening of the monetary policy of the US Federal Reserve. Traders' enthusiasm may turn out to be short-lived, as the overall national labor market still looks strong: employment rose by 223.0K, exceeding forecasts, while unemployment fell to 3.5%, confirming the threat of further inflationary growth has not been eliminated. Regulator officials note that it is too early to reverse course on the abolition of economic incentives, and interest rates need to be kept at high levels for a long time, and in the long term, the pressure of monetary factors on the digital asset market will continue.
btc.png


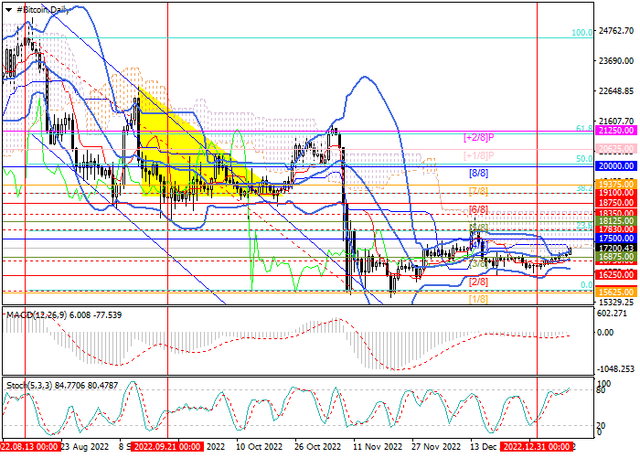
The trading instrument continues to grow towards 17830 (Fibonacci correction 23.6%) and 18350 (the area of December highs). The key "bearish" level is the middle line of Bollinger bands around 16750, the breakdown of which will let the price return to 16250 (Murrey level [5/8]) and 15700 (the area of November lows).

Resistance levels: 17830, 18350 | Support levels: 16750, 16250, 15700​
 
PayPal - A fall is possible.

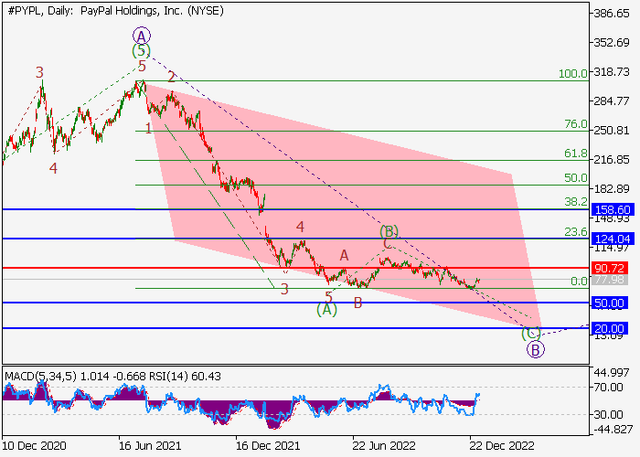
If the assumption is correct, the price of the asset will fall to the area of 50 – 20. In this scenario, critical stop loss level is 90.72.

paypal.png
 
USDCHF hits the second target

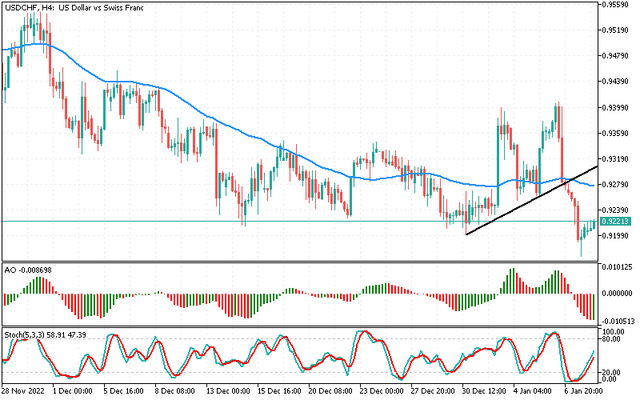
The USDCHF pair managed to achieve our second waited target at 0.9215 and attempts to confirm breaking it, reinforcing the expectations of continuing the domination of the bearish trend, reminding you that our next target reaches 0.9100.

usdchf.png


Holding below 0.9265 represents key condition to continue the expected decline, as breaching it will push the price to start recovery attempts and head towards 0.9340 followed by 0.9435 areas as main positive targets. The expected trading range for today is between 0.9140 support and 0.9265 resistance.​
 
ETHUSD - Technical Analysis

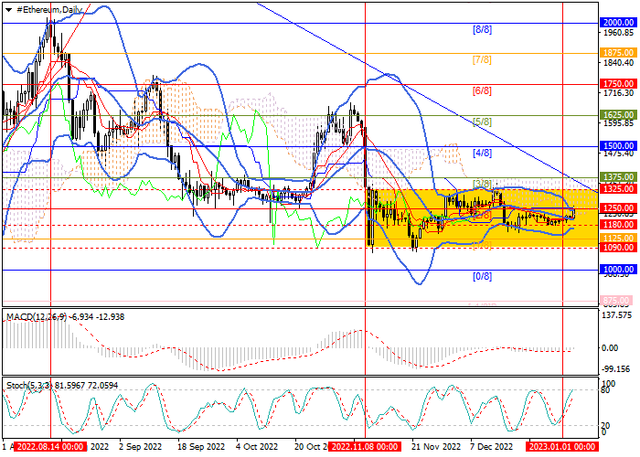
The ETHUSD pair continues to trade in the main sideways range of 1325 - 1090, but this week the price has reached the upper limit and is actively testing it. With a significant consolidation above, the instrument will be able to leave the framework of the long-term descending channel and continue to grow to the levels of 1437.5 (Murray level [7/8], Fibo retracement 61.8%) and 1500 (Murray level [8/8]).

eth.png


The key for the "bears" is the level of 1250 (Murray level [4/8]), supported by the middle line of the Bollinger Bands, overcoming which will allow the decline to resume to the area of 1125 (Murray level [2/8]), 1062.5 (Murray level [1/8]) and 1000 (Murray level [0/8]).

Resistance levels: 1325, 1437.5, 1500 | Support levels: 1250, 1125, 1062.5, 1000​
 

Gold Completes the Bullish Pattern

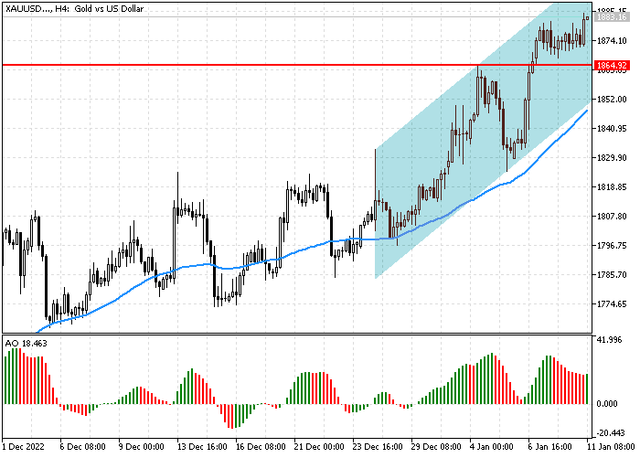
Gold price managed to breach the bullish flag’s resistance and settled above it, to get positive motive that we are waiting to push the price to provide new positive trading that its targets begin at 1900 and extend to 1928.6.

gold.png


The EMA50 continues to support the price from below, to keep the bullish trend scenario valid and active in the upcoming sessions unless breaking 1865.00 and holding below it. The expected trading range for today is between 1860 support and 1900 resistance.​
 
Crude Oil Price Under the Negative Pressure

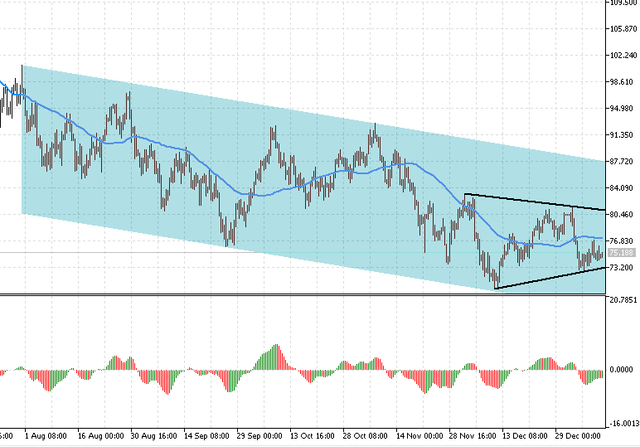
Crude oil price tested 75.65 resistance line and bounced bearishly to settle at the key intraday support line that rises now to 74.30, to keep the price stuck between these levels, which keeps our neutrality valid until now, waiting to breach one of the mentioned levels to detect the next targets clearly.

oil.png


Note that breaking the mentioned support will press on the price to resume the main bearish trend that its targets begin at 72.4 and extend to 70.3, while breaching the resistance will lead the price to achieve new gains that target 76.75 followed by 78.90 as next main stations. The expected trading range for today is between 72.5 support and 76 resistance.​
 

XRPUSD - Growth as Part of the general market trend

The positive dynamics of quotes may be associated with the airdrop of the Flare token (FLR) planned two years ago, which since Monday has been distributed among XRP owners in a one-to-one ratio: in total, about 4.28B coins were distributed, the main volume of which will soon was sold. This token is an integral part of a startup that should ensure the interaction of the Ripple ecosystem with other blockchains.

Further prospects for the asset look uncertain, and much depends on the monetary and judicial decisions that will be made soon. In particular, on Thursday, investors expect the publication of December data on US consumer inflation: a slowdown in its growth will give the US Federal Reserve a reason to slow down the pace of monetary policy tightening. Otherwise, the cryptocurrency sector may be under new pressure. Also, XRP may lose ground if the Southern District of New York court, which is considering the US Securities and Exchange Commission (SEC) lawsuit against Ripple, satisfies the regulator's latest petition and recognizes the documents of its former chairman William Hinman as confidential. In this case, the company's lawyers will lose the main argument with which they tried to prove that XRP is not a security, and the case may not be decided in their favor.

xrp.png


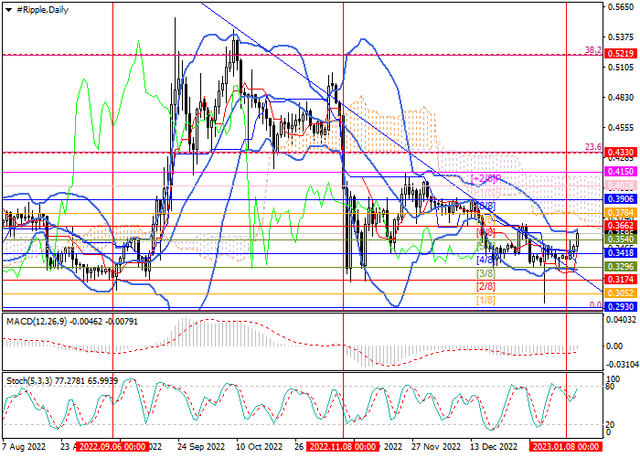
Currently, the trading instrument has left the long-term downward channel and is close to 0.3662 (Murrey level [6/8]), the breakout of which will give the prospect of further growth to 0.3906 (Murrey level [8/8]), 0.4150 (Murrey level [+2/8]) and 0.4330 (Fibonacci retracement 23.6%). The key "bearish" level is 0.3296 (Murrey level [3/8], the lower line of Bollinger bands). If it is broken down, the price will be able to continue falling to 0.2930 (Murrey level [0/8]).

Resistance levels: 0.3662, 0.3906, 0.4150, 0.433 | Support levels: 0.3296, 0.3052, 0.293​
 
Shares of Pfizer, the largest US pharmaceutical company, are correcting at 47.

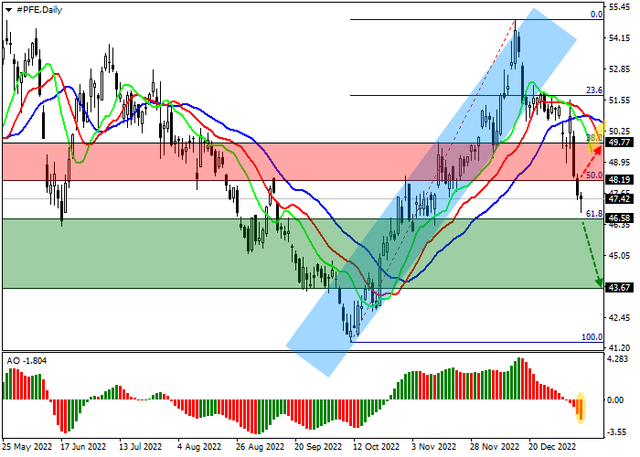
The daily chart shows that the price is declining, consolidating below the 50.0% Fibonacci interim retracement at 48.2.

pfe.png


On the four-hour chart, it can be seen that the downward movement may continue if the quotes manage to break the main support — the full correction level of 61.8% Fibonacci 46.60. The already passed intermediate correction level of 50.0% at 48.20 prevents the change of the trend, but so far, such a movement looks unlikely.

Technical indicators reinforce the sell signal.​
 
EURUSD Surpasses the Resistance

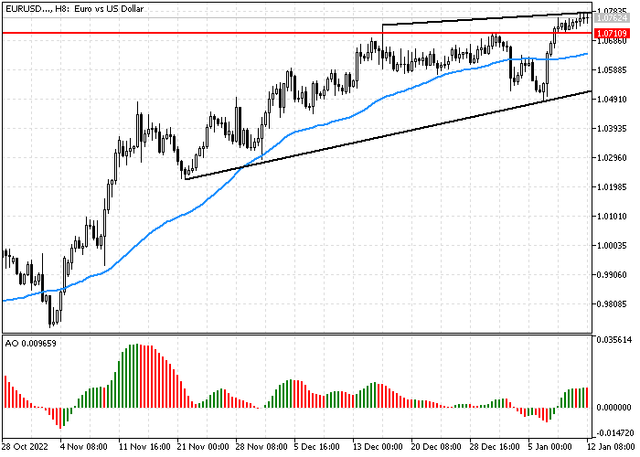
The EURUSD pair managed to breach 1.0745 level and hold above it, reinforcing the expectations of continuing the bullish trend in the upcoming sessions, opening the way to head towards 1.0915 as a next main station, supported by the EMA50.

gold.png


On the other hand, we should note that breaking 1.0745 and holding below it will put the price under negative pressure that targets testing 1.0645 areas initially.

The expected trading range for today is between 1.0700 support and 1.0860 resistance.​
 
NZDUSD Awaits the Breach

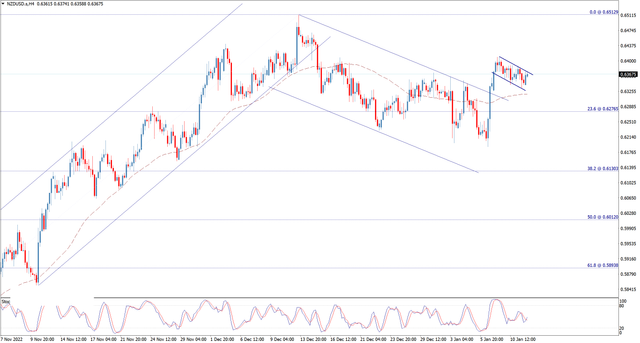
The NZDUSD pair continues to fluctuate within the bullish flag pattern, waiting to breach 0.6375 to activate the positive effect of this pattern followed by rallying towards 0.6440 followed by 0.6510 levels mainly.

nzdusd.png


In general, the bullish trend will remain valid conditioned by the price stability above 0.6275. The expected trading range for today is between 0.6330 support and 0.6450 resistance.​
 
Back
Top