2023 Market Forecast by Solid ECN

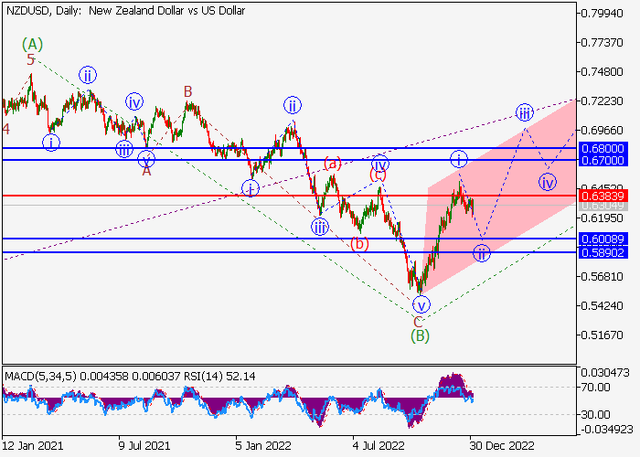
NZDUSD - The price is in a correction, a fall is possible.

On the daily chart, the upward wave of the higher level (А) formed, a downward correction ended as the wave (B), and the development of the wave (C) started. Now, the first entry wave of the lower level i of 1 of (C) has formed, and a local correction is developing as the second wave ii of 1 of (C), within which the wave (c) of ii is forming.

If the assumption is correct, the NZDUSD pair will fall to the area of 0.6008 – 0.5890. In this scenario, critical stop loss level is 0.6383.

nzdusd.png
 

AUDUSD - Growth is possible.

On the daily chart, the first wave of the higher level (1) formed, a downward correction ended as the second wave (2), and the development of the third wave (3) started, within which the first entry wave of the lower level i of 1 of (3) develops. Now, the wave (iii) of i has developed, a local correction has ended as the wave (iv) of i, and the wave (v) of i is developing.

If the assumption is correct, the AUDUSD pair will grow to the area of 0.7040–0.7142. In this scenario, critical stop loss level is 0.6681.

audusd.png
 
Gold Price Gathers Positive Momentum

Gold price continues to rise, organized inside new bullish channel that appears on the chart, noticing that stochastic gets rid of its negative momentum gradually, waiting to motivate the price to resume the bullish wave that its next target located at 1900. Therefore, our bullish overview will remain valid and active unless breaking 1820.50 and holding below it.

gold.png


The expected trading range for today is between 1840 support and 1875 resistance.​
 
Chart of the day - US500

FOMC minutes released yesterday have been rather hawkish with the document noting that US central bankers do not expect rate cuts in 2023. It also noted that while progress has been made in bringing inflation back under control, more rate hikes are needed although a slower pace may be adequate. Release can be seen as hawkish but no major long-lasting market reaction occurred in the aftermath. This can be reasoned with the fact that FOMC minutes have only repeated what the market has already known and has already been pricing in.

us500.png


Taking a look at US500 chart at H4 interval, we can see that the index has been struggling to launch a larger move in either direction as of late. US500 has been trading in a 3,800 - 3,920 pts range since mid-December, awaiting catalyst for the next bigger move. While today's ADP employment report at 1:15 pm GMT is unlikely to be such a catalyst, tomorrow's NFP data may be source of elevated volatility.​
 
EURUSD Tests the Support

The EURUSD pair settles at 1.0515 support line, as the price keeps its consolidation above this level, accompanied by witnessing clear positive signals through stochastic, to believe that the chances valid to resume the main bullish trend, which its targets begin at 1.0625 and extend to 1.0745 after surpassing the previous level.

eurusd.png


Therefore, we will continue to suggest the bullish trend for the upcoming period, noting that breaking 1.0515 will push the price to achieve additional decline that targets 1.0425 areas initially. The expected trading range for today is between 1.0470 support and 1.0620 resistance.​
 
Silver Price Reaches the Target

Silver price reached few pips away from our waited target at 23.05 and begins to rebound bullishly from there, to hint heading to resume the main bullish trend and achieve gains that start at 23.75 and extend to 24.55.

silver.png


Therefore, the bullish bias will be expected for today, motivated by stochastic current positivity, taking into consideration that breaking 23.05 will stop the positive scenario and press on the price to achieve more bearish correction. The expected trading range for today is between 23.10 support and 24 resistance.​
 
Crude Oil Price Attempts to Recover

Crude oil price returns to rise and surpass the minor resistance 74.20, to hint new recovery attempts and head towards potential test to 75.63 as a first positive station, making the bullish trend expected for today, being aware that it is important to monitor the price when reaching the targeted level, as breaching it will lead the price to achieve more gains on the intraday and short term basis.

oil.png


On the other hand, we should note that breaking 73.50 will stop the expected rise and press on the price to resume the bearish trend that its next main target located at 70.30. The expected trading range for today is between 73.00 support and 76.50 resistance.​
 

EURUSD - Growth is possible.

If the assumption is correct, the EURUSD pair will grow to the area of 1.1000 – 1.1196. In this scenario, critical stop loss level is 1.0485.

eurusd.png
 

GBPUSD - Growth is possible.​

If the assumption is correct, the GBP/USD pair will grow to the area of 1.2900 – 1.3500. In this scenario, critical stop loss level is 1.1833.

gbpusd.png
 

GBPJPY Tends Towards the Positivity​

Despite the GBPJPY pair’s recent weak trades, its frequent positive consolidation above 158.7 increases the chances of renewing the bullish attempts, to keep waiting to react to stochastic positivity by targeting many positive stations near 161 and 162.9.

gbpjpy.png


On the other hand, facing new negative pressures and crawling below 158.70 support line will force it to renew the negative trades, to expect targeting the negative stations at 158 followed by 156.6. The expected trading range for today is between 159 and 161.​
 
Back
Top