Sive Morten
Special Consultant to the FPA
- Messages
- 18,699
Monthly
As Reuters reports, A three-day dollar rally sputtered out on Friday as world markets adapted to possible shifts in U.S. monetary policy and the euro rose on news of a record monthly euro zone current account surplus. The dollar, whose gains accelerated on Wednesday after the chair of the Federal Reserve hinted that U.S. interest rates may rise sooner than anticipated, eased against other major currencies. "We have had a decent correction and we are coming up for air," said David Gilmore, a partner at Foreign Exchange Analytics in Essex, Connecticut. "We've had a modest shift in the Fed's tone, and it's not that dramatic." Fed leader Janet Yellen on Wednesday seemed to suggest the central bank might end sooner than generally expected its low-interest policies, put in place after the global financial crisis. Such a shift would rattle global financial markets. Gilmore said the currency market had misinterpreted Yellen's qualified remarks and overreacted, saying, "I think you will see Yellen and others (at the Fed) try to walk all that back."
The euro, which this week had been trading just shy of $1.40, was up 0.15 percent for the day in late New York trading to $1.3798. The shared currency had a Friday trading high of $1.3811 after striking a two-week low of $1.3749 on Thursday. Speculation that the United States may accelerate the end of ultra-low interest rates had obscured international trade flows and other economic fundamentals that favor the euro over the dollar, said Michael Woolfolk, senior market strategist at Bank of New York Mellon in New York. "It's a return to the mean," Woolfolk said. "What we are seeing is a return to where the euro wants to be: above the $1.38 level." The euro was also helped by capital inflows. With the European Central Bank showing little inclination to ease monetary policy soon, analysts said flows into rate-sensitive money markets are likely to continue alongside robust demand for European stocks and peripheral euro zone bonds. Data from the ECB on Friday showed the euro zone's current account surplus hit a record in January, when portfolio investments rose to 16.9 billion euros. "Investors are awaiting for further confirmation from the Fed on its rate path, especially if U.S. data in the second quarter starts to look up," said Geoffrey Yu, currency strategist at UBS. "For us, the dollar is a buy on dips."
CRIMEA TENSIONS SUPPORT YEN, SWISS FRANC
The safe-haven yen and Swiss franc outperformed as traders grew cautious going into the weekend amid rising tension between Russia and the West following Moscow's annexation of Crimea. Russian stocks fell as investors digested the impact of U.S sanctions over the crisis in Ukraine. EU leaders meeting in Brussels are also mulling wider economic sanctions.
Meanwhile, the Chinese yuan steadied after hitting a 13-month low with traders saying there were signs that the currency may be finding a base. The yuan has shed more than 1.2 percent so far this week, a record weekly loss, after the central bank last weekend doubled the currency's permitted trading range to 2 percent either side of the fixing. Many saw this as a signal of official comfort with the currency's recent losses, with the central bank keen to shake out hot money from the market.
Technical
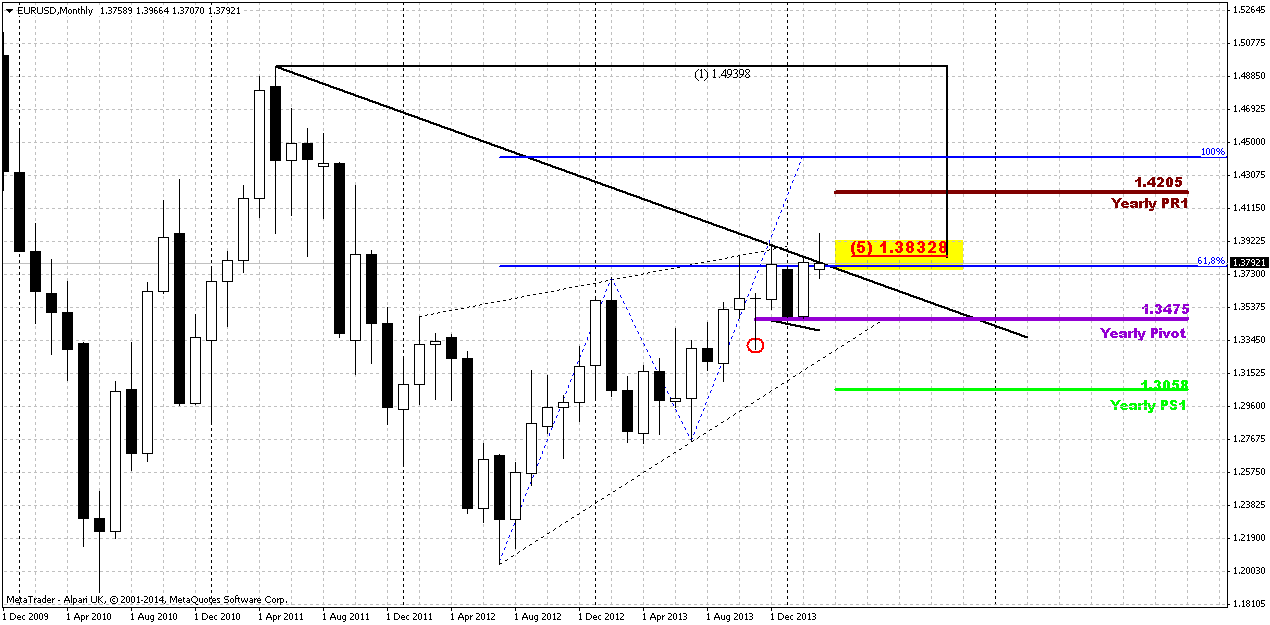
Only on previous week we’ve talked about upward action that might become real bullish continuation to higher targets, but right now we again have to discuss warning signs. I’m speaking about second return of price right back down – out from resistance area.Trend holds bullish on monthly time frame and on big picture nothing drastical has happened yet. As we’ve said previously - until market stands above 1.33 we can’t tell that EUR has turned down.
Speaking about fundamentals we will talk on recent Fed statement and economy data. But as you have read above – experts think that there was some overreaction on Yellen hints about interest rates. Besides, it is still unclear situation economy itself. Either is due weather or not... Currently investors have twofold thoughts on fundamental data. One group tells that recent poor data comes from tough winter and as spring is coming, situation should improve significantly and we’ve seen this improvement in March data already. Another group suggests that US economy situation stands as it is and winter has no relation to it They thought that it is too early to talk about any improvement. Let’s see what data we will get in March and in the beginning of April.
As we’ve noted upward bounce has started precisely from 1.3475 level. Now the major question stands as follows – whether this upward action is a confirmation of long-term bullish sentiment or just a respect of YPP first touch. Following the chart we see very useful combination for us – YPP stands very close to 1.33 – our invalidation point. And if market will move below YPP this will become bearish moment by itself.
Previously we’ve made important conclusion based on market mechanics. If we will follow to it, we’ll see that currently market should not show any solid retracement down. Any move of this kind should be treated as market weakness and it will increase probability of reversal down. Take a look that as market has hit minor 0.618 AB-CD extension target right at rock hard resistance – Fib level and Agreement and former yearly PR1, it has shown reasonable bounce down to 1.33. As retracement after 0.618 target already has happened, it is unlogical and unreasonable to see another deep bounce and if it will happen - it will look suspicious. Right now market still stands on the edge here. From one point of view price has failed to break up in 2013, but from another one – it still stands very close to previous highs. And YPP is exceptionally important here.
Second moment – if this was true revresal down from AB-CD 0.618 target market should not return right back up to it and particularly should not form any bullish consolidation right below it.
But now let me put a spoon of tar in a barrel of bull’s honey. I would like to discuss recent back action out from new highs. This is not good for bulls. Again, as our forum member Kamuta said - “Sive does not use simple tools as trend lines” – and now we could get failure breakout. Also it looks like W&R again. This action carries nothing positive in short-term perspective. Even if it will not lead to drastical reversal down, but it could trigger meaningful retracement. But if market will return right back to YPP – this will be done not just to test it again, right? In this case price could move lower...
Still, speaking about monthly upside targets... If this was real break through resistance, we have two major targets – AB=CD one around 1.44 and Yearly PR1 = 1.4205.
Thus, here we can make following conclusion – nothing drastical yet, but action is not very pleasant for bulls. It could trigger solid retracement down on lower time frames.
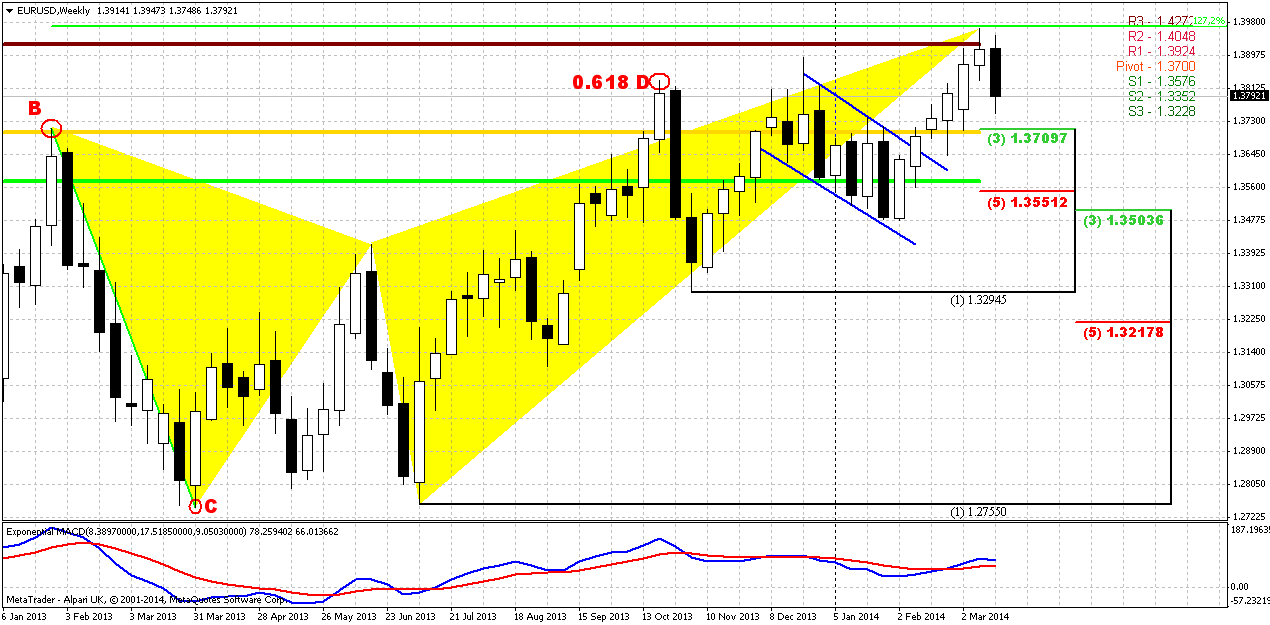
Weekly
Here chart has not changed much – bounce that we’ve expected to see has started on passed week. Actually within recent month were focused on nearest butterfly target – 1.27 around 1.3960 area. If we would be precise to the letter, we can say that market has not reached the target for 8 pips, but this is not significant for weekly chart. Probably now we can say that market has accomplished butterfly target and has done it after 6 weeks upward rally.
Although situation on monthly chart has not turned south absolutely and even moderately bullish, market could turn to downward retracement during nearest month as we’ve suggested above.
Technically speaking, we have following bearish issues. First is butterfly itself. This is reversal pattern and should trigger at minimum 3/8 retracement down. As action to the 1.27 target was very smooth and gradual, even heavy, hardly market will easily continue move higher right now. Second issue is MPR1. Market has tested it, but MPR1 has held price action. Current AB-CD pattern has reached minor 0.618 target, but CD leg is much flatter than AB and this is the sign of weakness. Thus, some bounce down could happen in nearest future. The major problem is to estimate the target of possible retracement.
Speaking about bearish reversal criteria ideal peformance is to see butterfly completion and then – move below 1.33 lows. In this case we will get reversal swing on weekly chart that could become at least something that could confirm downward ambitions.
But until market holds above 1.33 and YPP – we will treat current action only as retracement and respect of butterfly’s target.
Bullish sentiment will be confirmed again if we will see move above 1.3980 – butterfly 1.27 target first. In this case next target will be right around 1.43-1.44 – weekly AB-CD, Yearly PR1 and butterfly 1.618.
So, conclusion on weekly time frame stands as follows. Market has reached solid resistance level and the probability of retracement down increases significantly. Nearest level to watch for is 1.3710 – first Fib support and MPP. As market is not overbought it should not show too deep retracement, if it is still bullish. Any move below 1.35 K-support level could lead to bearish reversal confirmation. But right now picture looks not as awful as on daily chart. Market has significant downside reserve till we will start to talk about bearish long-term reversal...
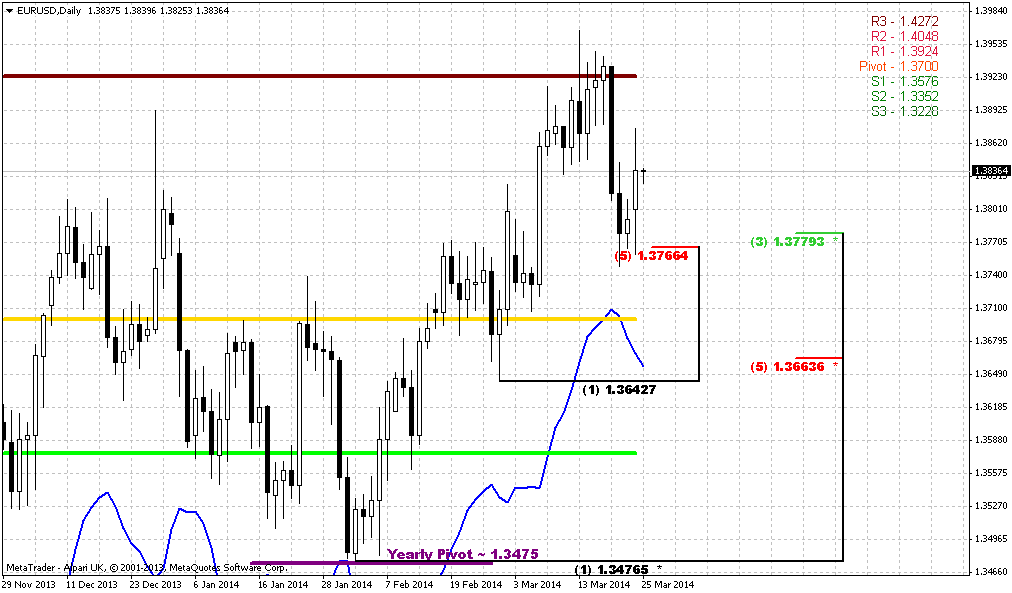
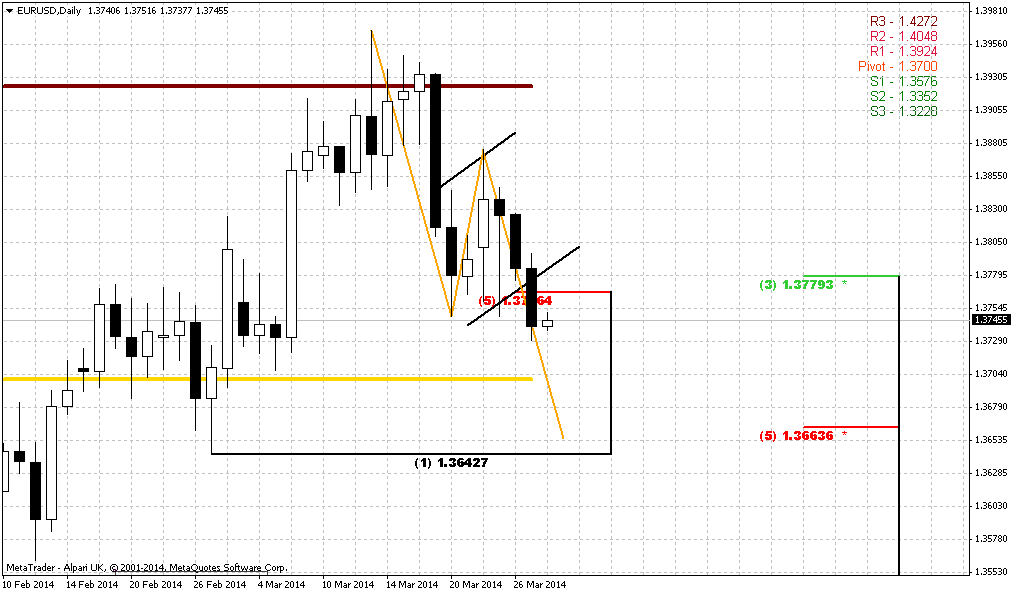
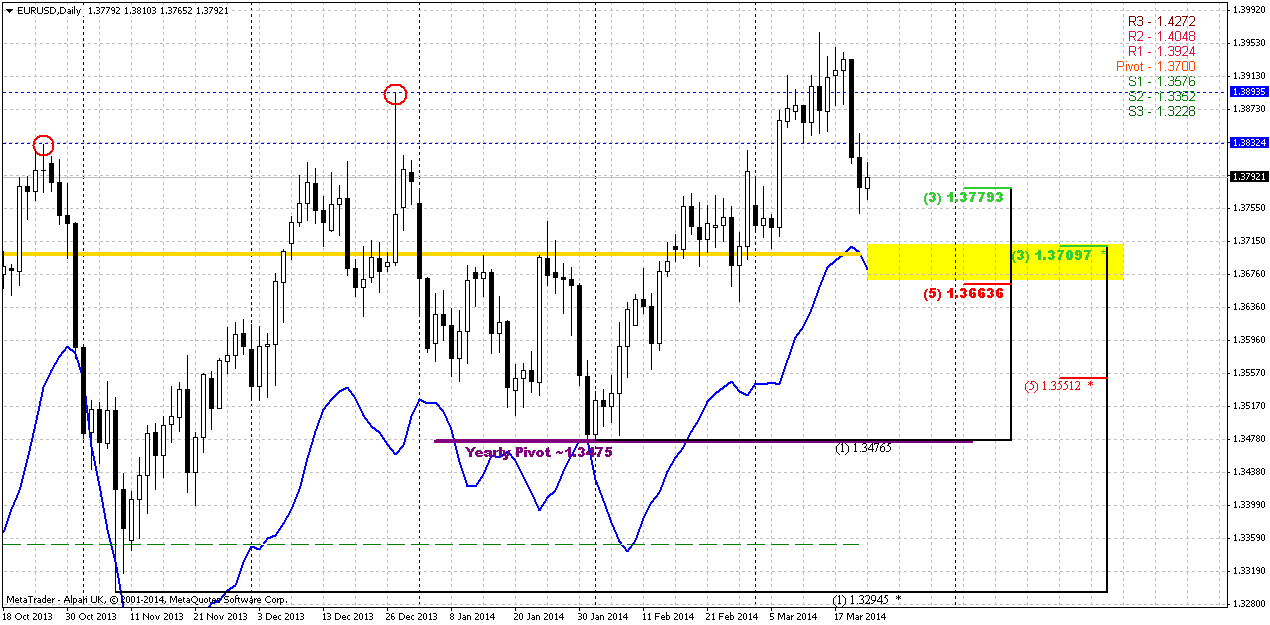
Daily
Price has moved below both of previous tops and hit first Fib support level. Trend is bearish but not oversold yet. So, as we’ve estimated that downward retracement could reach 1.37 area first – right now if any bounce will follow – it will be small probably. First significant bounce up could happen from 1.37 since this is K-support, MPP and daily oversold. Since we do not have any patterns here, or daily chart – we can trade only trend right now. Thus, we can try to take short position on minor retracement up on intraday charts with target around 1.37 or whatever they will be due some patterns.
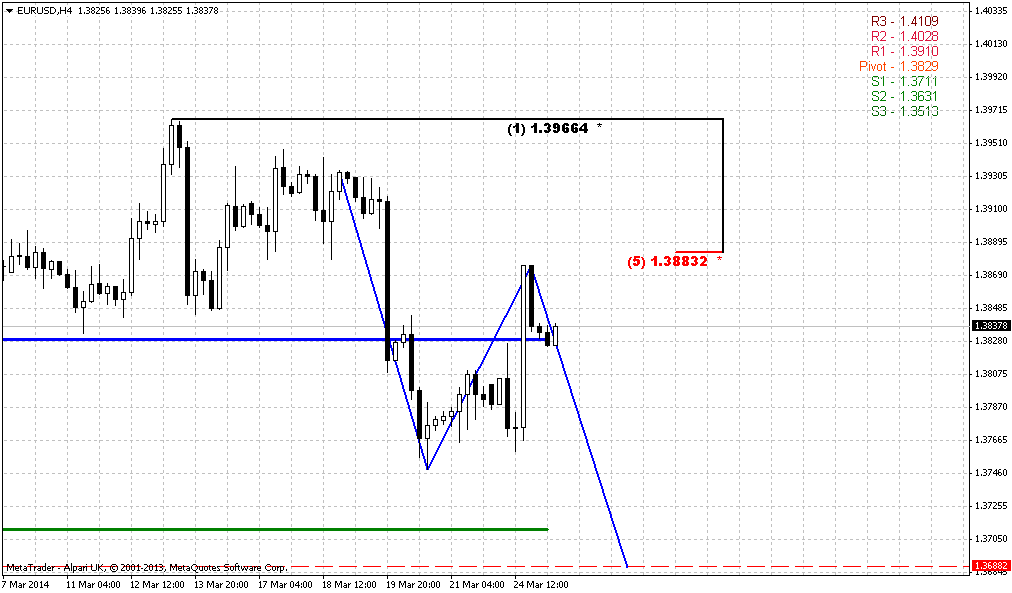
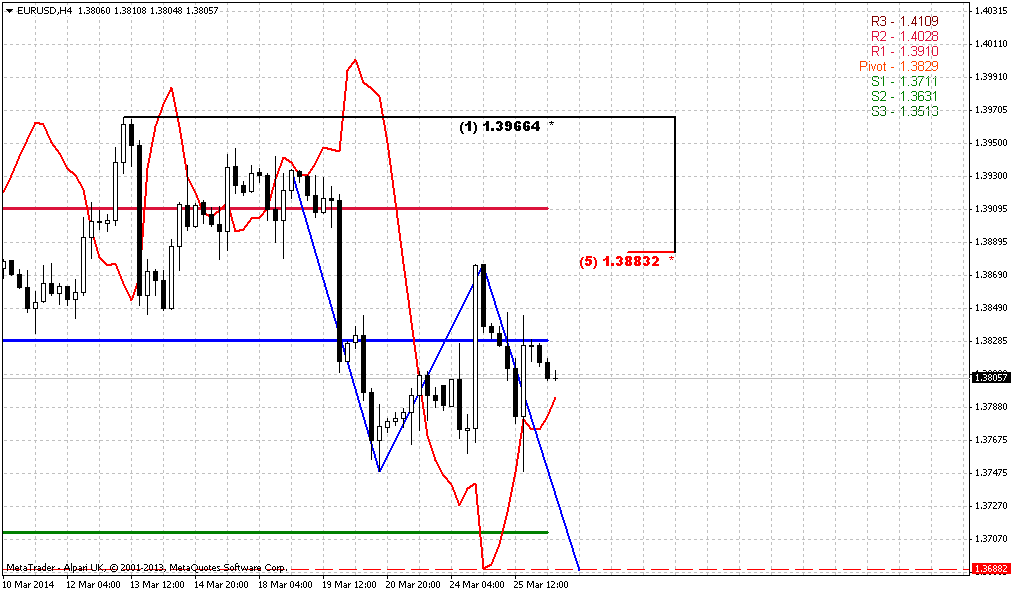
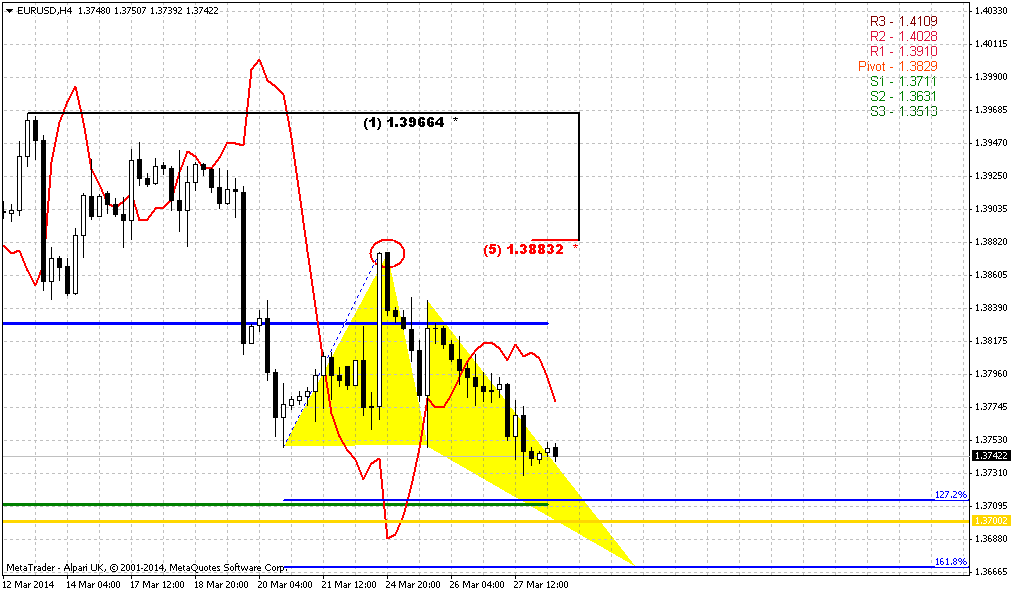
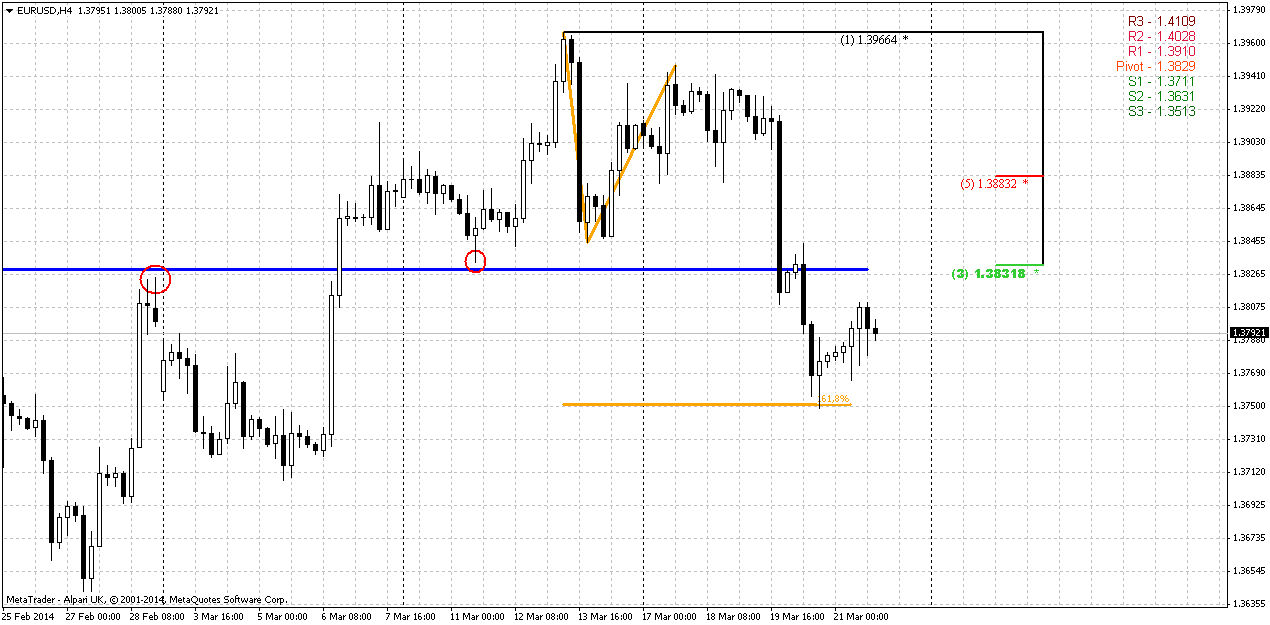
4-hour
Based on this picture 1.38-1.3850 area looks nice for short entry. As you can see, daily Fib Support is also an Agreement since price simultaneously has reached 1.618 AB=CD target. This has triggered retracement up. Now, around 1.3850 area we have WPP, Fib resistance and natural resistance area. This level is a border of former consolidation and as a rule price protects it. Thus, as upward retracement looks heavy as well, it seems that it makes sense to focus particularly on this area for possible short entry.
Conclusion:
On long-term charts price action looks moderately bullish, but right now market has hit significant resistance and completed long-term reversal pattern. Retracement down in nearest 1-2 weeks has very high probability. Our task here is to understand whether it will be just retracement (and bullish context will hold) or we will have to change our mind and start to look south?
On coming week we can trade only trend direction, since we do not have any patterns by far. Thus, our short-term plan is to wait retracement up to WPP on Monday and try to take position to 1.37 area.
The technical portion of Sive's analysis owes a great deal to Joe DiNapoli's methods, and uses a number of Joe's proprietary indicators. Please note that Sive's analysis is his own view of the market and is not endorsed by Joe DiNapoli or any related companies.
As Reuters reports, A three-day dollar rally sputtered out on Friday as world markets adapted to possible shifts in U.S. monetary policy and the euro rose on news of a record monthly euro zone current account surplus. The dollar, whose gains accelerated on Wednesday after the chair of the Federal Reserve hinted that U.S. interest rates may rise sooner than anticipated, eased against other major currencies. "We have had a decent correction and we are coming up for air," said David Gilmore, a partner at Foreign Exchange Analytics in Essex, Connecticut. "We've had a modest shift in the Fed's tone, and it's not that dramatic." Fed leader Janet Yellen on Wednesday seemed to suggest the central bank might end sooner than generally expected its low-interest policies, put in place after the global financial crisis. Such a shift would rattle global financial markets. Gilmore said the currency market had misinterpreted Yellen's qualified remarks and overreacted, saying, "I think you will see Yellen and others (at the Fed) try to walk all that back."
The euro, which this week had been trading just shy of $1.40, was up 0.15 percent for the day in late New York trading to $1.3798. The shared currency had a Friday trading high of $1.3811 after striking a two-week low of $1.3749 on Thursday. Speculation that the United States may accelerate the end of ultra-low interest rates had obscured international trade flows and other economic fundamentals that favor the euro over the dollar, said Michael Woolfolk, senior market strategist at Bank of New York Mellon in New York. "It's a return to the mean," Woolfolk said. "What we are seeing is a return to where the euro wants to be: above the $1.38 level." The euro was also helped by capital inflows. With the European Central Bank showing little inclination to ease monetary policy soon, analysts said flows into rate-sensitive money markets are likely to continue alongside robust demand for European stocks and peripheral euro zone bonds. Data from the ECB on Friday showed the euro zone's current account surplus hit a record in January, when portfolio investments rose to 16.9 billion euros. "Investors are awaiting for further confirmation from the Fed on its rate path, especially if U.S. data in the second quarter starts to look up," said Geoffrey Yu, currency strategist at UBS. "For us, the dollar is a buy on dips."
CRIMEA TENSIONS SUPPORT YEN, SWISS FRANC
The safe-haven yen and Swiss franc outperformed as traders grew cautious going into the weekend amid rising tension between Russia and the West following Moscow's annexation of Crimea. Russian stocks fell as investors digested the impact of U.S sanctions over the crisis in Ukraine. EU leaders meeting in Brussels are also mulling wider economic sanctions.
Meanwhile, the Chinese yuan steadied after hitting a 13-month low with traders saying there were signs that the currency may be finding a base. The yuan has shed more than 1.2 percent so far this week, a record weekly loss, after the central bank last weekend doubled the currency's permitted trading range to 2 percent either side of the fixing. Many saw this as a signal of official comfort with the currency's recent losses, with the central bank keen to shake out hot money from the market.
Technical
Only on previous week we’ve talked about upward action that might become real bullish continuation to higher targets, but right now we again have to discuss warning signs. I’m speaking about second return of price right back down – out from resistance area.Trend holds bullish on monthly time frame and on big picture nothing drastical has happened yet. As we’ve said previously - until market stands above 1.33 we can’t tell that EUR has turned down.
Speaking about fundamentals we will talk on recent Fed statement and economy data. But as you have read above – experts think that there was some overreaction on Yellen hints about interest rates. Besides, it is still unclear situation economy itself. Either is due weather or not... Currently investors have twofold thoughts on fundamental data. One group tells that recent poor data comes from tough winter and as spring is coming, situation should improve significantly and we’ve seen this improvement in March data already. Another group suggests that US economy situation stands as it is and winter has no relation to it They thought that it is too early to talk about any improvement. Let’s see what data we will get in March and in the beginning of April.
As we’ve noted upward bounce has started precisely from 1.3475 level. Now the major question stands as follows – whether this upward action is a confirmation of long-term bullish sentiment or just a respect of YPP first touch. Following the chart we see very useful combination for us – YPP stands very close to 1.33 – our invalidation point. And if market will move below YPP this will become bearish moment by itself.
Previously we’ve made important conclusion based on market mechanics. If we will follow to it, we’ll see that currently market should not show any solid retracement down. Any move of this kind should be treated as market weakness and it will increase probability of reversal down. Take a look that as market has hit minor 0.618 AB-CD extension target right at rock hard resistance – Fib level and Agreement and former yearly PR1, it has shown reasonable bounce down to 1.33. As retracement after 0.618 target already has happened, it is unlogical and unreasonable to see another deep bounce and if it will happen - it will look suspicious. Right now market still stands on the edge here. From one point of view price has failed to break up in 2013, but from another one – it still stands very close to previous highs. And YPP is exceptionally important here.
Second moment – if this was true revresal down from AB-CD 0.618 target market should not return right back up to it and particularly should not form any bullish consolidation right below it.
But now let me put a spoon of tar in a barrel of bull’s honey. I would like to discuss recent back action out from new highs. This is not good for bulls. Again, as our forum member Kamuta said - “Sive does not use simple tools as trend lines” – and now we could get failure breakout. Also it looks like W&R again. This action carries nothing positive in short-term perspective. Even if it will not lead to drastical reversal down, but it could trigger meaningful retracement. But if market will return right back to YPP – this will be done not just to test it again, right? In this case price could move lower...
Still, speaking about monthly upside targets... If this was real break through resistance, we have two major targets – AB=CD one around 1.44 and Yearly PR1 = 1.4205.
Thus, here we can make following conclusion – nothing drastical yet, but action is not very pleasant for bulls. It could trigger solid retracement down on lower time frames.
Weekly
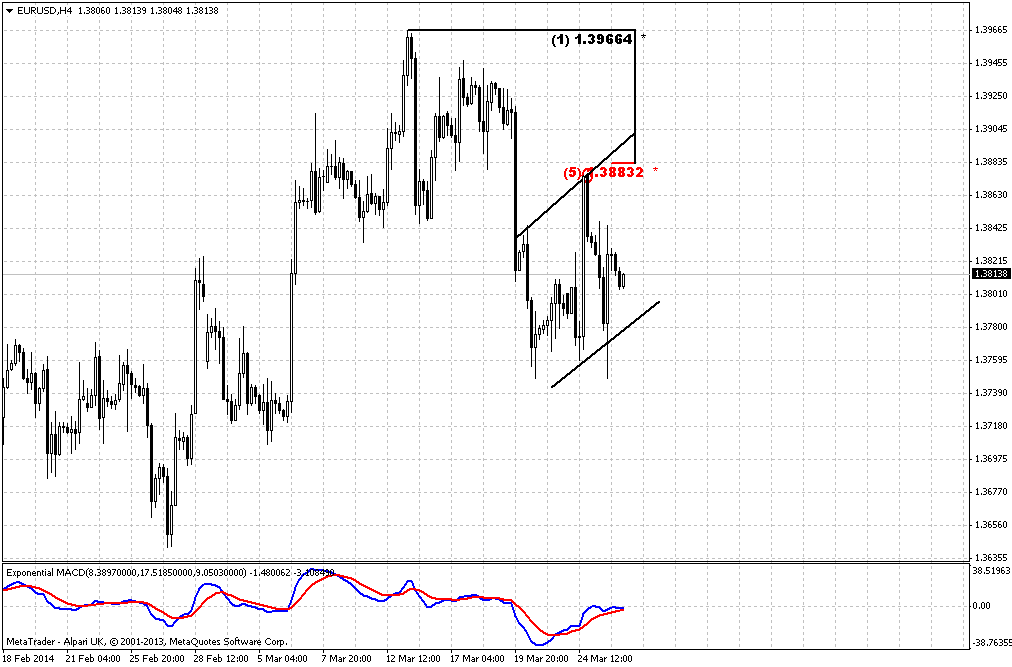
Here chart has not changed much – bounce that we’ve expected to see has started on passed week. Actually within recent month were focused on nearest butterfly target – 1.27 around 1.3960 area. If we would be precise to the letter, we can say that market has not reached the target for 8 pips, but this is not significant for weekly chart. Probably now we can say that market has accomplished butterfly target and has done it after 6 weeks upward rally.
Although situation on monthly chart has not turned south absolutely and even moderately bullish, market could turn to downward retracement during nearest month as we’ve suggested above.
Technically speaking, we have following bearish issues. First is butterfly itself. This is reversal pattern and should trigger at minimum 3/8 retracement down. As action to the 1.27 target was very smooth and gradual, even heavy, hardly market will easily continue move higher right now. Second issue is MPR1. Market has tested it, but MPR1 has held price action. Current AB-CD pattern has reached minor 0.618 target, but CD leg is much flatter than AB and this is the sign of weakness. Thus, some bounce down could happen in nearest future. The major problem is to estimate the target of possible retracement.
Speaking about bearish reversal criteria ideal peformance is to see butterfly completion and then – move below 1.33 lows. In this case we will get reversal swing on weekly chart that could become at least something that could confirm downward ambitions.
But until market holds above 1.33 and YPP – we will treat current action only as retracement and respect of butterfly’s target.
Bullish sentiment will be confirmed again if we will see move above 1.3980 – butterfly 1.27 target first. In this case next target will be right around 1.43-1.44 – weekly AB-CD, Yearly PR1 and butterfly 1.618.
So, conclusion on weekly time frame stands as follows. Market has reached solid resistance level and the probability of retracement down increases significantly. Nearest level to watch for is 1.3710 – first Fib support and MPP. As market is not overbought it should not show too deep retracement, if it is still bullish. Any move below 1.35 K-support level could lead to bearish reversal confirmation. But right now picture looks not as awful as on daily chart. Market has significant downside reserve till we will start to talk about bearish long-term reversal...
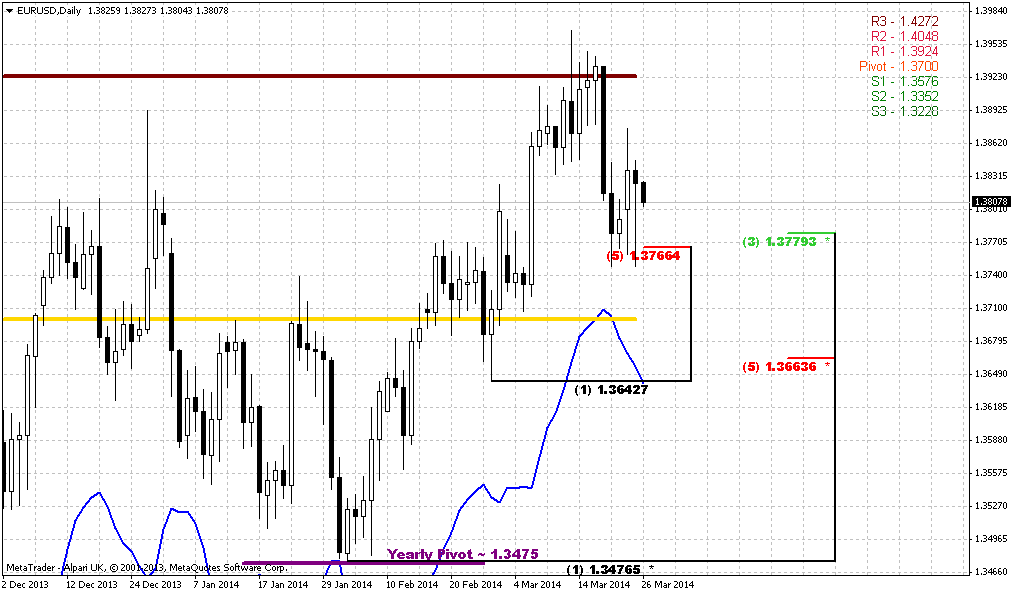
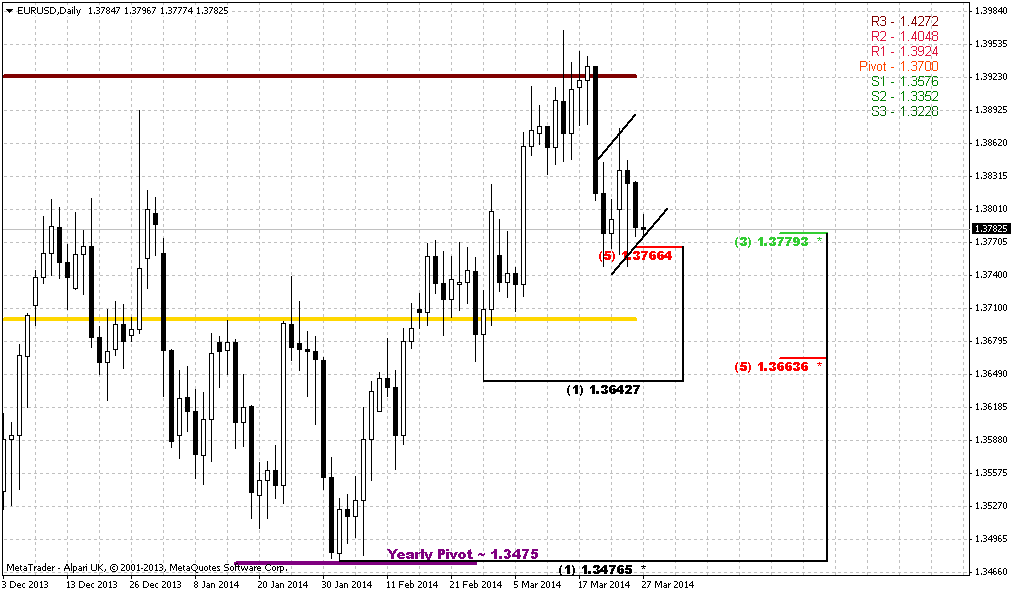
Daily
Price has moved below both of previous tops and hit first Fib support level. Trend is bearish but not oversold yet. So, as we’ve estimated that downward retracement could reach 1.37 area first – right now if any bounce will follow – it will be small probably. First significant bounce up could happen from 1.37 since this is K-support, MPP and daily oversold. Since we do not have any patterns here, or daily chart – we can trade only trend right now. Thus, we can try to take short position on minor retracement up on intraday charts with target around 1.37 or whatever they will be due some patterns.
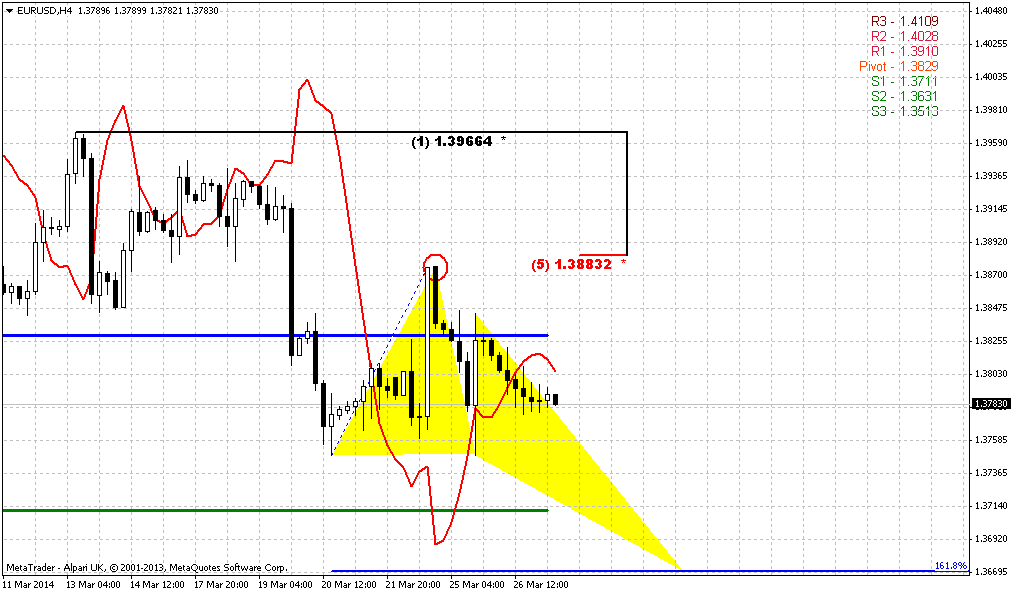
4-hour
Based on this picture 1.38-1.3850 area looks nice for short entry. As you can see, daily Fib Support is also an Agreement since price simultaneously has reached 1.618 AB=CD target. This has triggered retracement up. Now, around 1.3850 area we have WPP, Fib resistance and natural resistance area. This level is a border of former consolidation and as a rule price protects it. Thus, as upward retracement looks heavy as well, it seems that it makes sense to focus particularly on this area for possible short entry.
Conclusion:
On long-term charts price action looks moderately bullish, but right now market has hit significant resistance and completed long-term reversal pattern. Retracement down in nearest 1-2 weeks has very high probability. Our task here is to understand whether it will be just retracement (and bullish context will hold) or we will have to change our mind and start to look south?
On coming week we can trade only trend direction, since we do not have any patterns by far. Thus, our short-term plan is to wait retracement up to WPP on Monday and try to take position to 1.37 area.
The technical portion of Sive's analysis owes a great deal to Joe DiNapoli's methods, and uses a number of Joe's proprietary indicators. Please note that Sive's analysis is his own view of the market and is not endorsed by Joe DiNapoli or any related companies.
Last edited: