Vlad RF
RoboForex Representative
- Messages
- 487
Harmonic Patterns in Trading
Author : Victor Gryazin

Dear Clients and Partners,
In this article, we will consider the use of harmonic patterns in trading. We will get acquainted with the history of their emergence, and the principles of their formation, and tell you about the most popular patterns.
What are harmonic patterns?
Harmonic patterns are graphical price patterns based on a combination of Fibonacci ratios and Elliott wave elements. The basis for such patterns was laid down in the works of Harold Gartley, a renowned analyst, and technical analysis specialist. His book "Profits in the Stock Market" describes his trading methodology in detail.
The harmonic patterns became widely known and popular at the end of the last century when Gartley's works were further developed by his followers – Scott Carney, Larry Pesavento, and Bryce Gilmore. They have refined the description of already known models, and also identified and described new ones.
Harmonic patterns are versatile: they can be used to trade on different timeframes and financial markets. The most popular are Gartley, Butterfly, 5-0, Crab, ABCD, Bat, and Shark.
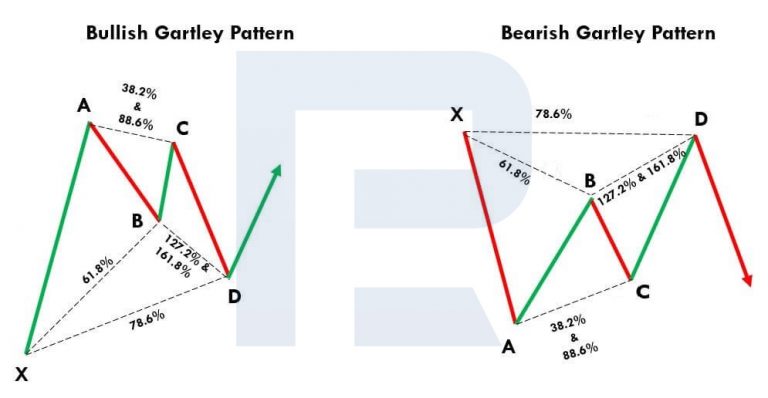
Gartley pattern
The Gartley pattern is one of the first harmonic patterns described. It is also called "Gartley's butterfly" because of the similarity in the outlines of price movements, and the Fibonacci lines on the chart resembling the wings of a butterfly.
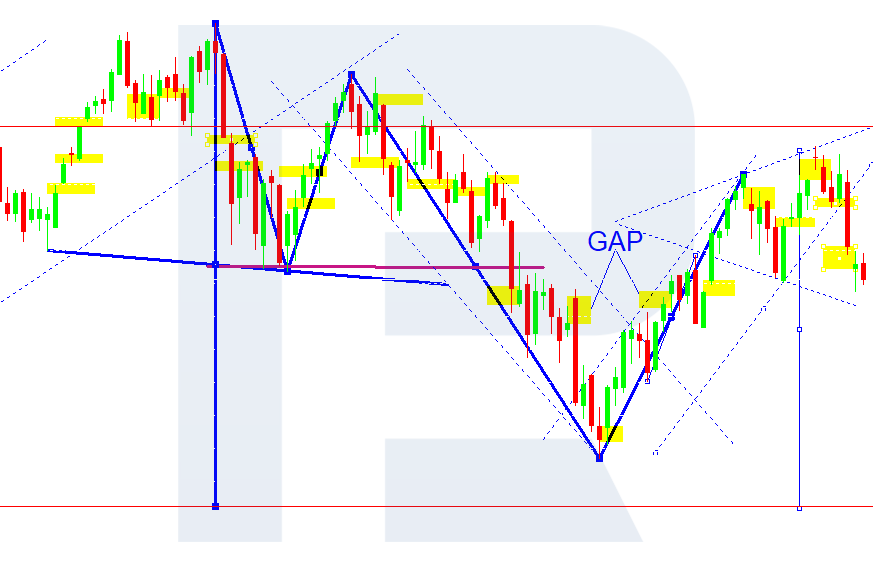
Stages in the formation of the Gartley pattern:
Butterfly pattern
The Butterfly pattern, created by Bruce Gilmore, is very similar to the one mentioned above. Therefore, understandably, many traders confuse the two.
Stages in the formation of the Butterfly pattern
5-0 Pattern
The 5-0 pattern was first described in detail in Scott Carney's book "Harmonic Trading: Volume Two", which was published in 2007. Visually, it resembles the Head & Shoulders and Wolf Waves patterns.
Read more at R Blog - RoboForex
Sincerely,
RoboForex team
Author : Victor Gryazin
Dear Clients and Partners,
In this article, we will consider the use of harmonic patterns in trading. We will get acquainted with the history of their emergence, and the principles of their formation, and tell you about the most popular patterns.
What are harmonic patterns?
Harmonic patterns are graphical price patterns based on a combination of Fibonacci ratios and Elliott wave elements. The basis for such patterns was laid down in the works of Harold Gartley, a renowned analyst, and technical analysis specialist. His book "Profits in the Stock Market" describes his trading methodology in detail.
The harmonic patterns became widely known and popular at the end of the last century when Gartley's works were further developed by his followers – Scott Carney, Larry Pesavento, and Bryce Gilmore. They have refined the description of already known models, and also identified and described new ones.
Harmonic patterns are versatile: they can be used to trade on different timeframes and financial markets. The most popular are Gartley, Butterfly, 5-0, Crab, ABCD, Bat, and Shark.
Gartley pattern
The Gartley pattern is one of the first harmonic patterns described. It is also called "Gartley's butterfly" because of the similarity in the outlines of price movements, and the Fibonacci lines on the chart resembling the wings of a butterfly.
Stages in the formation of the Gartley pattern:
- XA is the first impulse of the price movement on the chart
- AB is the correction from the first XA movement at approximately 61.8%
- BC can be 38.2%, 50%, 61.8%, 78.6%, 88.6% of the AB wavelength
- CD can be 127.2%, 146%, 150%, and 161.8% of the BC wavelength and ends around the correction level of 78.6% of the XA wavelength
- The D-point is the final point in the pattern, where a reversal of quotes is expected
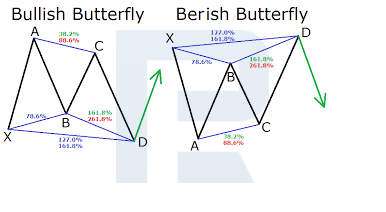
Butterfly pattern
The Butterfly pattern, created by Bruce Gilmore, is very similar to the one mentioned above. Therefore, understandably, many traders confuse the two.
Stages in the formation of the Butterfly pattern
- XA is the first impulse of the price movement on the chart
- AB is the correction from the first XA movement at approximately 78.6%
- BC can range from 38.2% to 88.6% of the AB wavelength
- CD can range from 161.8% to 224% of the BC wavelength and ends at about 127.2% of the XA wavelength
- The D-point is the final point in the pattern, where a reversal of quotes is expected
5-0 Pattern
The 5-0 pattern was first described in detail in Scott Carney's book "Harmonic Trading: Volume Two", which was published in 2007. Visually, it resembles the Head & Shoulders and Wolf Waves patterns.
Read more at R Blog - RoboForex
Sincerely,
RoboForex team