fxoday
Recruit
- Messages
- 884
Hello everyone has a nice day, always there is new hope in the market.
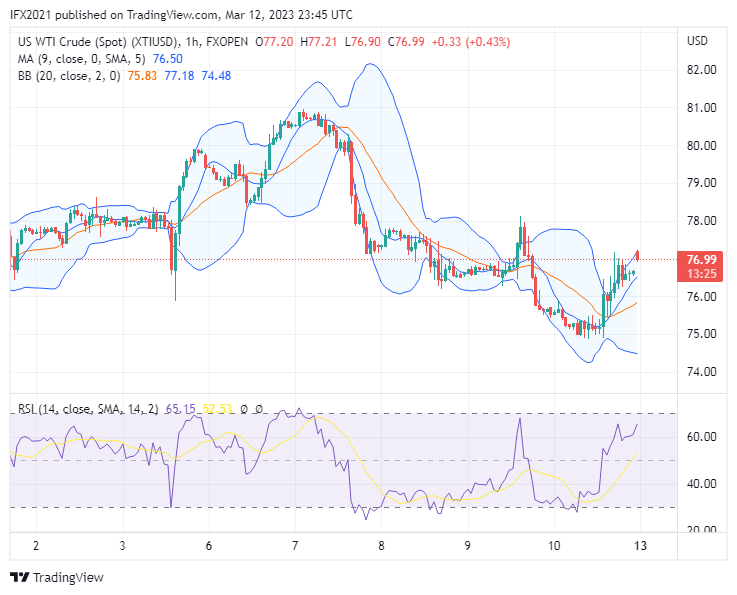
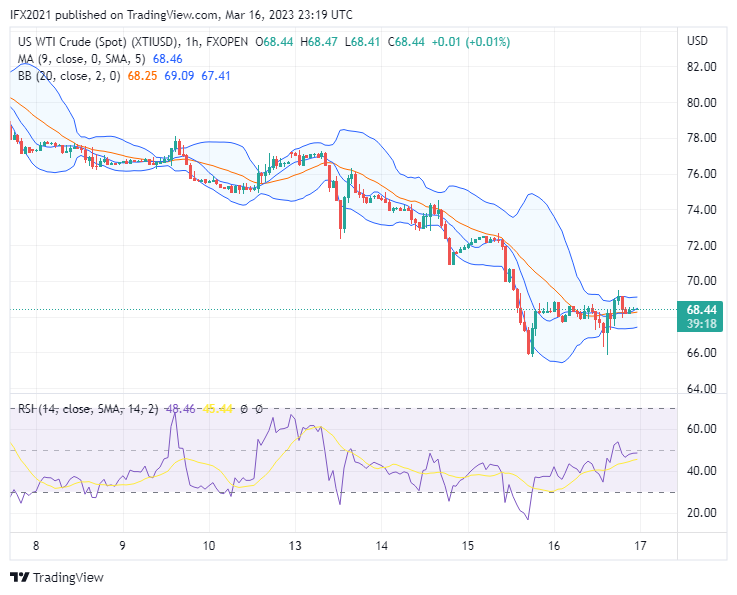
Oil prices yesterday's move crossed down the middle band line trying to reach the next support. The price formed a small bearish candle.
There are rumors the oil price fell because fears of more aggressive rate hikes by the U.S. Federal Reserve continued to compound, with losses extending.
On Tuesday, Federal Reserve Chairman Jerome Powell said the Fed would most likely find it necessary to raise interest more than expected to control inflation as a result of strong U.S. economic data.
XTIUSD Technical analysis
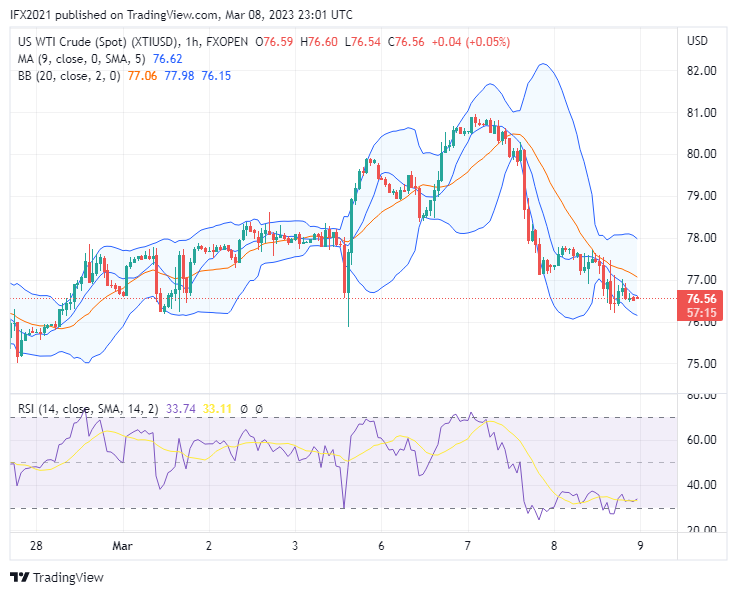
Oil price today is 76.56 based on the XTIUSD chart FXOpen in the Tradingview, yesterday oil price dropped 1%, and looking for new support.
In the daily timeframe, we can see Oil prices already cross down the middle band line which means the price is below the downtrend line. Here Bollinger band flat indicates the market is sideways, while the MA line is also flat indicating sideways. In another hand, the RSI indicator shows the number of 47 which means the price is below the downtrend zone level.
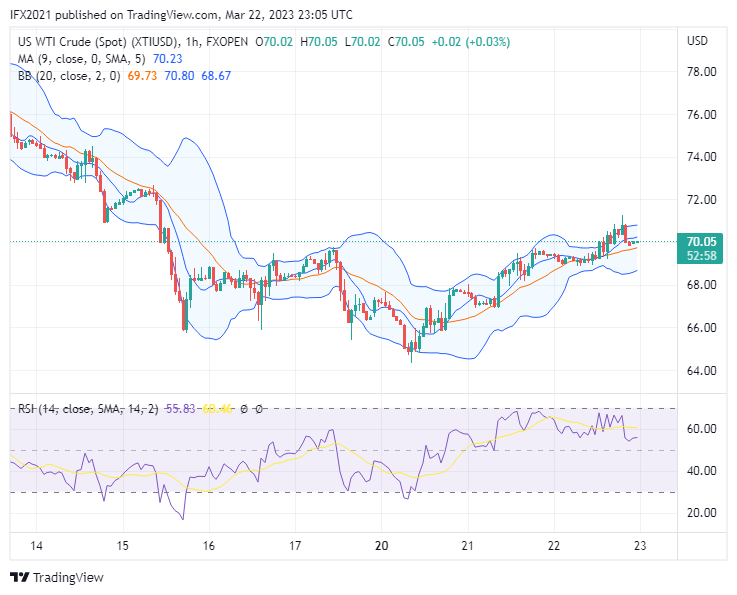
Go to the H1 timeframe, oil price now move near the lower band line below the MA line, there is higher volatility seen by expanding the band's line. While the RSI level tries to away from the oversold zone at level 35.
Disclaimer: CFDs are complex instruments and come with a high risk of losing your money.
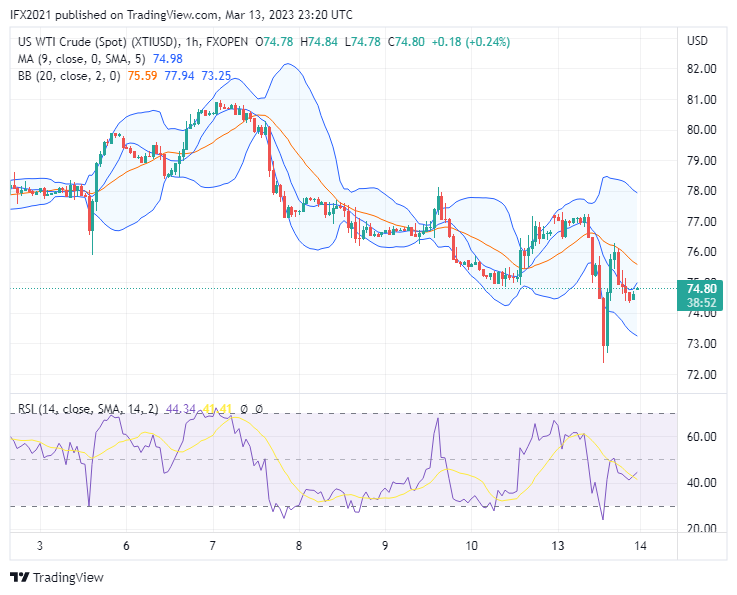
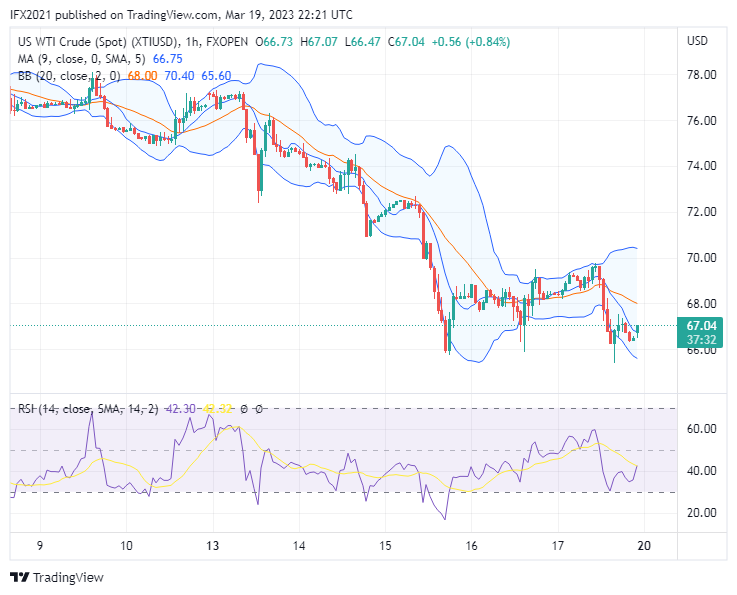
Oil prices yesterday's move crossed down the middle band line trying to reach the next support. The price formed a small bearish candle.
There are rumors the oil price fell because fears of more aggressive rate hikes by the U.S. Federal Reserve continued to compound, with losses extending.
On Tuesday, Federal Reserve Chairman Jerome Powell said the Fed would most likely find it necessary to raise interest more than expected to control inflation as a result of strong U.S. economic data.
XTIUSD Technical analysis
Oil price today is 76.56 based on the XTIUSD chart FXOpen in the Tradingview, yesterday oil price dropped 1%, and looking for new support.
In the daily timeframe, we can see Oil prices already cross down the middle band line which means the price is below the downtrend line. Here Bollinger band flat indicates the market is sideways, while the MA line is also flat indicating sideways. In another hand, the RSI indicator shows the number of 47 which means the price is below the downtrend zone level.
Go to the H1 timeframe, oil price now move near the lower band line below the MA line, there is higher volatility seen by expanding the band's line. While the RSI level tries to away from the oversold zone at level 35.
Disclaimer: CFDs are complex instruments and come with a high risk of losing your money.