XTIUSD price analysis

Hello everyone, Monday market is open, starting new hope this week.

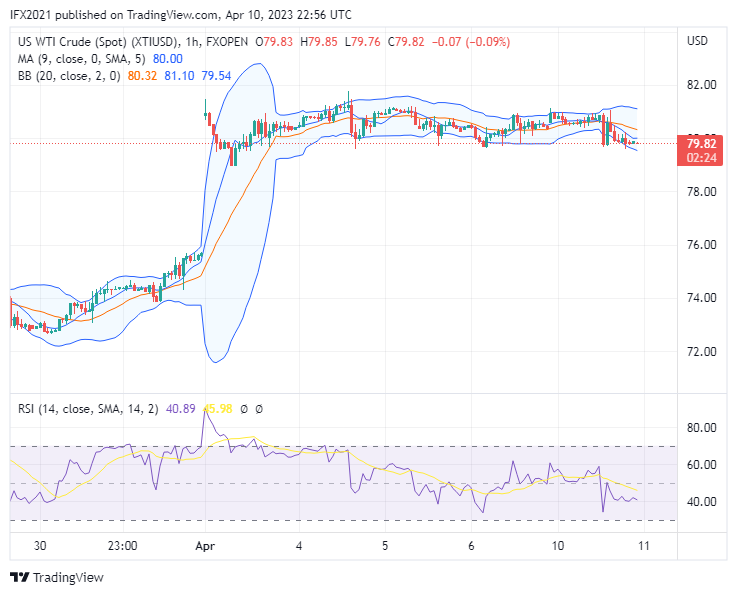
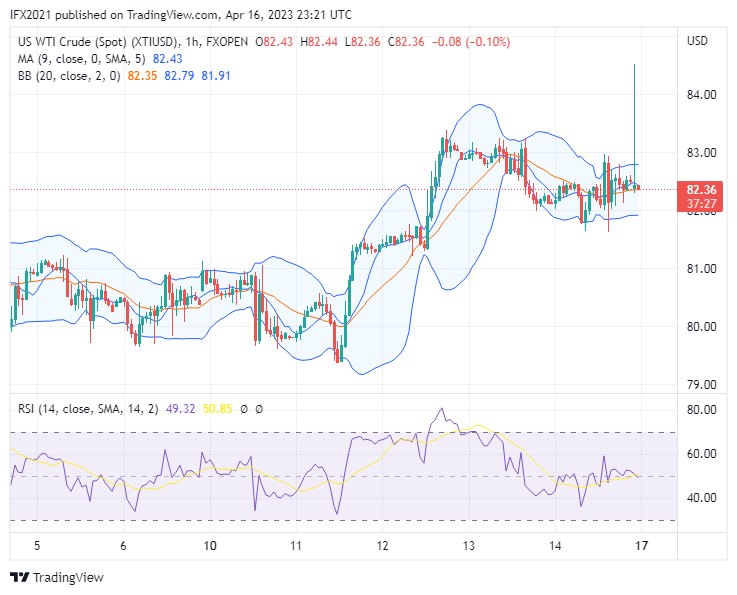
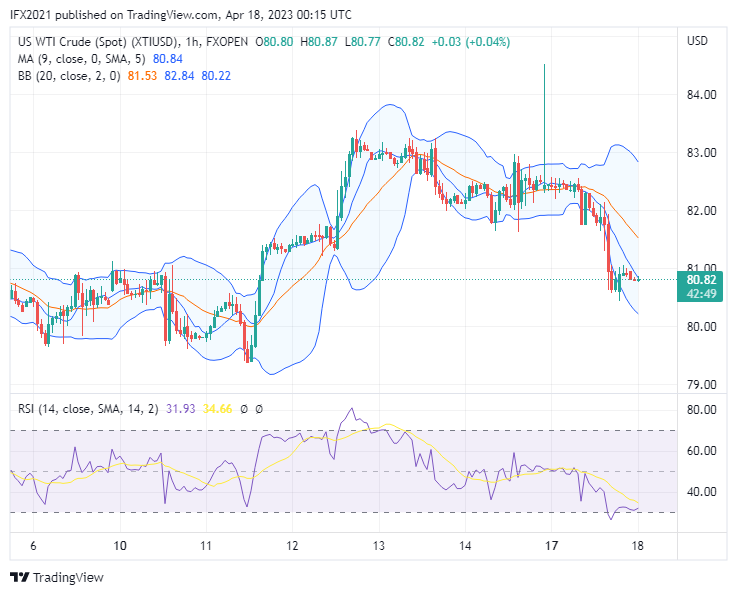
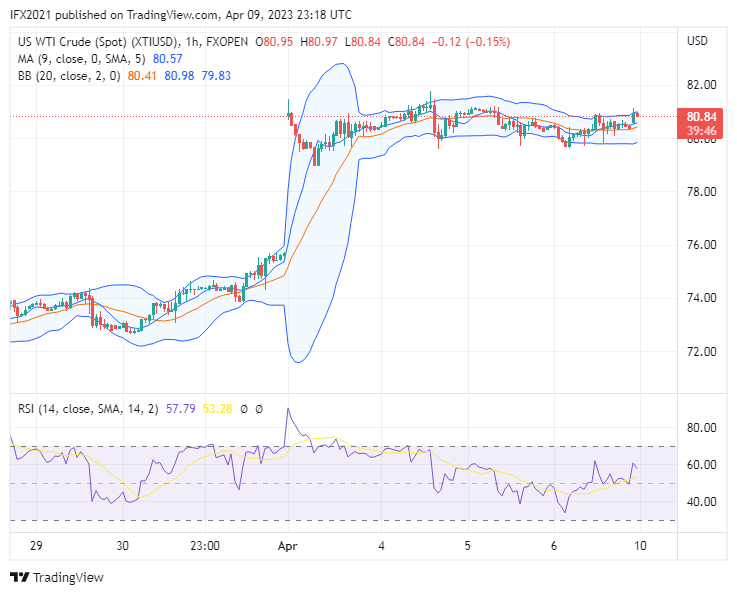
Oil price still trades steady near 80 level prices. Oil price at the time of writing at 80.84 based on the XTIUSD chart FXOpen in Tradingview.

Oil prices are still unchanged since breaking the upper band line a few days ago, Reuters writing oil steadies because economic fears counter OPEC+ cuts.

XTIUSD Technical analysis

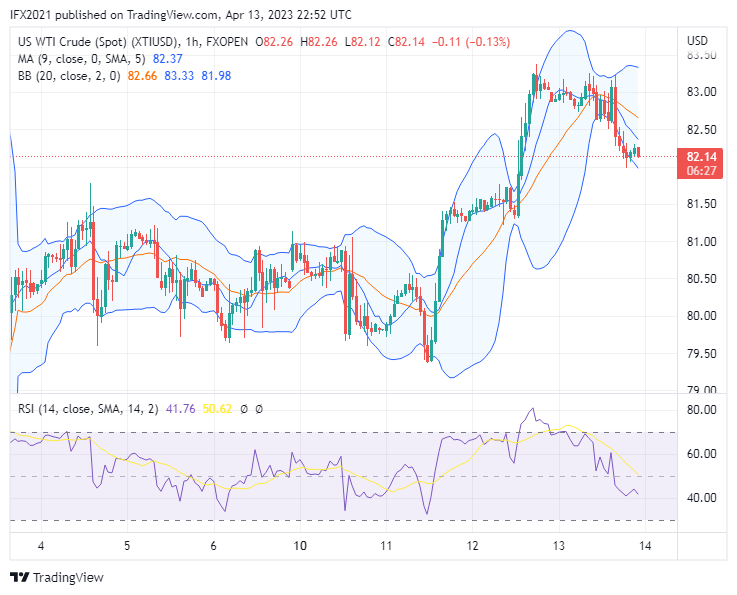
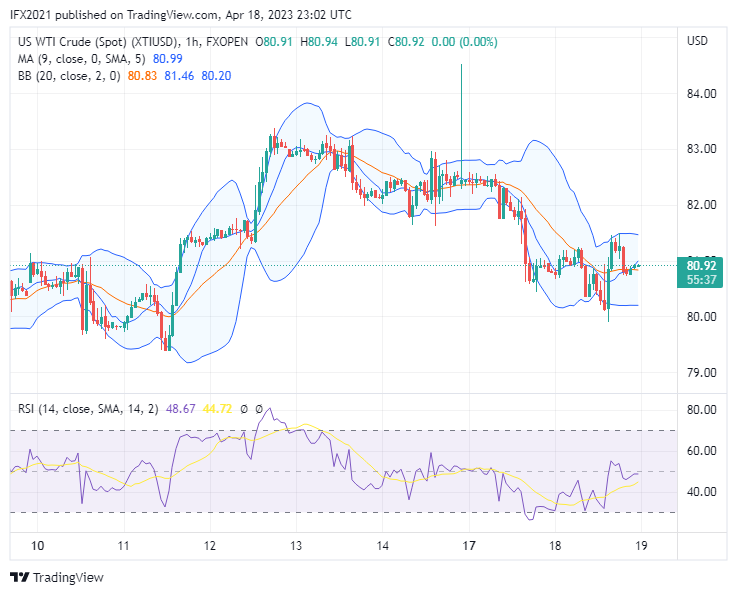
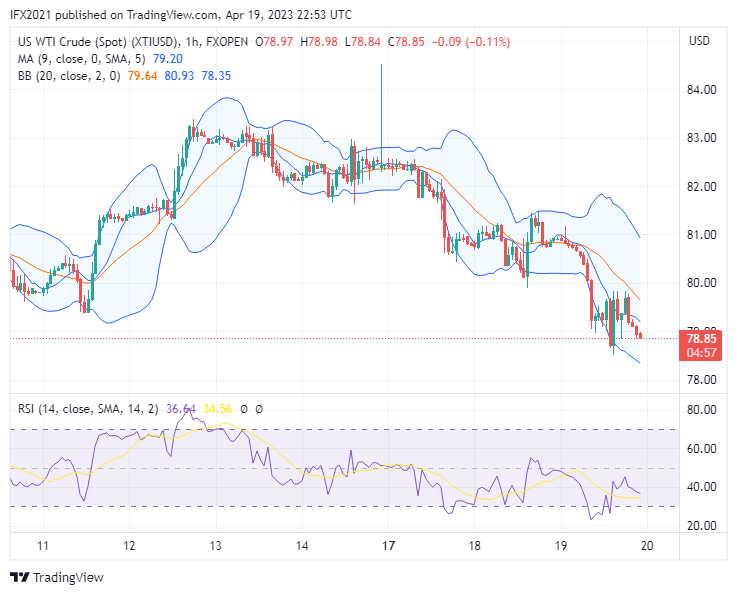
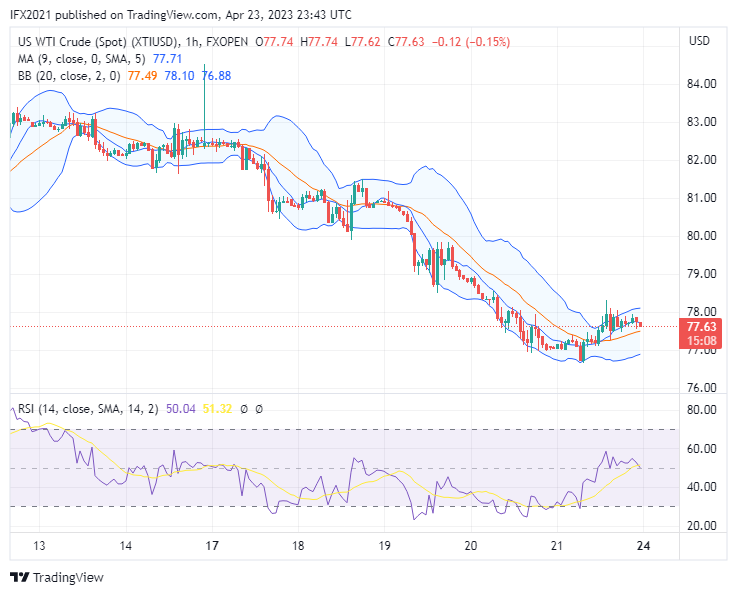
Oil prices still traded in a low trading range between 81.49 and 79 level prices. Now the price move below the upper band line.

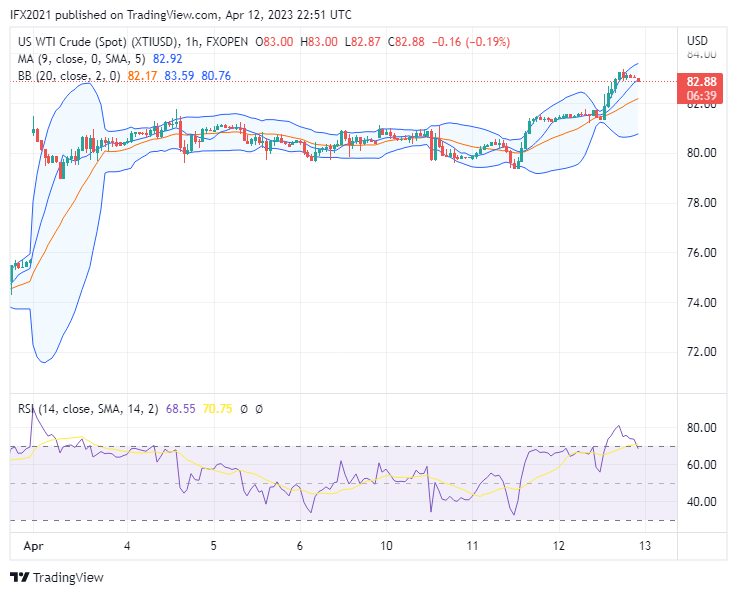
In the daily timeframe, the oil price has steady movement near the upper band line above MA and middle band line. while Bollinger's band draws a wide range indicating high volatile market occurs from the histories. Based MA line now the trend is above the bullish zone. While RSI shows a level of 65 which means the price is above the uptrend zone level near the overbought zone level.

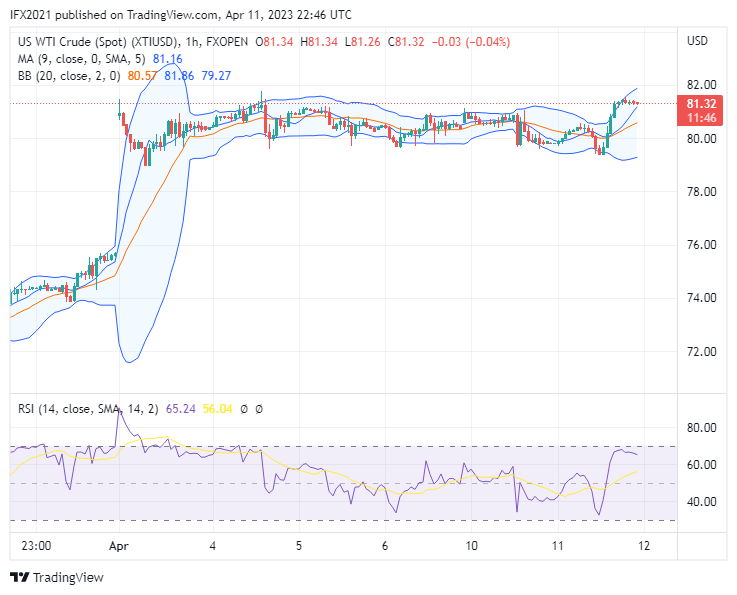
In the H1 timeframe, oil price we can see the Bollinger band squeeze waiting for the price breakout, and the oil market seems to be long time sleep in a flat market. While the RSI level shows the number 57 which means the price is above the uptrend zone level.

rlgSi0y3.png


Disclaimer: CFDs are complex instruments and come with a high risk of losing your money.
[/img]
 
Hello everyone, have a nice day, the market still gives new opportunities for all traders.

Oil prices are still steady moving near 80 level prices. The price move below the upper band line. The sideways market is still not yet over today. The current oil price is 79.82 based on the XTIUSD chart FXOpen in Tradingview.

News related oil citing to Oilprice, optimism over a possible rapprochement between Saudi Arabia and the U.S. is fading.

Oil production cut becomes a sign Saudi is moving to closer Russia, both Saudi and Russia want oil above $80.

XTIUSD Technical analysis

Oil prices still steadily traded at roughly 79 - 80 level price yesterday's high is 81.13 and the low was 79.60. The price is still not yet clear will the price move further uptrend or downtrend?

In the daily timeframe, oil prices still move below the upper band line, although the Bollinger band draws to expand, however, the price is still steady in the range. The price is far above the MA line and middle band line which means still above the uptrend zone level based on an indicator, while the RSI shows a level of 62 which means the price is above the uptrend zone level.

In the hourly timeframe, we can see Oil price move sideways in the trading range, Bollinger band squeeze not yet over waiting for the price breakout. While the RSI level shows 40 which means the price is below the downtrend zone level.

I7b31Ild.png


Disclaimer: CFDs are complex instruments and come with a high risk of losing your money.
 
Hello everyone, has a nice day, Wednesday market is open, always there is new hope in the new day.

Oil price eventually rose and now the price landed on 81.32 based on XTIUSD chart FXOpen in Tradingview.

According to analyst Oilprice, oil price returned to a recent high because OPEC+ announced it would cut production by another 1.6 million barrels per day.

XTIUSD technical analysis

Oil price moved to a high of 81.13 from a low of 79.60 on Tuesday's market. The price back to the recent high below the upper band line and formed a bullish candle with a small shadow.

In the daily timeframe, we can see the oil price far above the MA line and middle band line. Here Bollinger band still draws a wide range market with a support zone near 64 level price and resistance near 84 level price. Meanwhile, the RSI indicator shows a level of 65 which means the price still moves above the uptrend zone level.

In the H1 timeframe, oil prices now move near the upper band line above MA and middle band line. Here we can see Bollinger's band expand indicating a higher volatility market occurs. In the near term support zone is near the lower band at roughly 79.38 and the resistance zone is near the upper band at roughly 81.95. Here RSI indicator shows level 64 which means the price is above the uptrend zone level near the overbought zone level.

hOUDJb4h.png


Disclaimer: CFDs are complex instruments and come with a high risk of losing your money.
 
Hello everyone, have a nice day, still left opportunities to struggle in making a profit this week.

Oil prices eventually break high and formed a new high now. Oil price now landed at 82.88 based on the XTIUSD chart FXOpen in Tradingview.

An analyst from Oilprice says Oil gained amid the CPI core released yesterday, CPI US data shows lower than the previous year of the year making some pairs including XTIUSD move higher. Oil gained 2% after the US Data release.

XTIUSD technical analysis

Oil prices eventually break the 81-level price and formed a new high of 83.38 yesterday. Oil price move consolidated after a large gap occurs on the Monday market over a few days. Now rising oil prices increase volatility and Bollinger band draws to expand. On another edge, the RSI indicator shows a level of 68 near the overbought zone level indicating the bullish sentiment approaches the overbought zone level.

Take a look at the hourly timeframe, oil price finishes the consolidation zone after breaking the 81.68 level price. Now oil price move below the upper band and above the MA line and middle band line. There are retracement patterns in this timeframe that could MA line work as the first support zone near 82.50. Bollinger band expands indicating higher volatility. Meanwhile, the RSI indicator shows level 68 tries to out from the overbought zone level.

qOHTuH44.png


Disclaimer: CFDs are complex instruments and come with a high risk of losing your money.
 
Hello everyone, has a nice day, Friday market, there are some traders who avoid trading on Friday.

Oil prices now still move above the 81 level price, despite yesterday the price trying to rebound, however, the low price is still, higher than the previous low.

OPEC+ a few days ago announced the next oil production cut, and now they raised the forecast for oil demand from China will rise again.OPEC+ China’s oil demand is now expected to average 15.61 million bpd this year

XTIUSD technical analysis

Oil price now traded at 82.14 based on XTIUSD chart FXOpen in the Tradingview, oil price declined from a high of 83.38 and tries to retrace. However, the low price is still higher than the previous low which means volume sellers have not yet dragged the price dropped again to the 81 level price.

In the daily timeframe, we can see oil price move below the upper band line and far above the MA line and middle band line, here Bollinger band indicator still doesn't change still formed a wide range. The resistance zone is near the upper band at roughly 86.68 while the support zone is near 63.70. Here RSI indicator shows a level of 65 which means the price is above the uptrend zone level.

Oil price in the hourly timeframe, we can see the price move below the MA line and middle band line and form a downtrend pattern, while RSI shows the level of 41 which means the price is below the downtrend zone level.

uw0V9s85.png


Disclaimer: CFDs are complex instruments and come with a high risk of losing your money.]
 
Hello everyone, Monday's market is open, and new opportunities start again.

Oil price today is still above 82 level price, even though the price moved high 84.52 on Friday market, and dropped again to the current price at 82.36 based on the XTIUSD chart FXOpen in the Tradingview.

There are news citing to Oilprice report Russia's crude oil and refined product exports surged in March to the highest level since April 2020, as fuel exports jumped, bringing $1 billion more to Putin's oil revenues last month compared to February,

XTIUSD technical analysis

Oil price recently moves above the 82 level price, the price formed a higher price of 84 .52 and suddenly dropped on the same day to 82.29 and formed a Pin bar candle in the daily timeframe.

In the daily timeframe, the Bollinger band draws a wide range indicating high volatile market, while the price is above the MA line, and the middle band line indicates the price is still above the uptrend zone line. Meanwhile, RSI shows a level of 66 indicating the price is above the uptrend zone level.

Take a look at the hourly timeframe, oil price now moves near the middle band line and the MA line, and we can see a long wick in this timeframe, which means after the price move higher to above 84 then dropped in the same hour to enter the band line again. Meanwhile, RSI here we can see indicator shows level 50 which means the price is in the neutral zone level.

RxRVq2wq.png


Disclaimer: CFDs are complex instruments and come with a high risk of losing your money.
 
Hello everyone, has a nice day, today in a few days last Ramadhan Kareem.

Oil price yesterday even jumped to 84.53 and dropped again to a low of 80.44 in one day market.

Taking news from Oilprice with the title Hedge Funds Dropping China Stocks For American Oil, this reported on the tension between America vs China about Taiwan. It is possible international geopolitical impacts on the oil price.

XTIUSD technical analysis

Oil price now traded at 80.82 based on the XTIUSD chart FXOpen in the Tradingview.

In the daily timeframe, the oil prices now move near the MA line below the upper band line, we can see yesterday's oil price formed a long bearish candle with a long wick on a top candle. Here Bollinger band still draws a wide range line indicating high volatility market. Meanwhile, the RSI indicator shows a level of 60 which means the price is above the uptrend zone level.

Meanwhile, in the hourly timeframe, oil prices now move below the MA line and middle band line indicating a downtrend market. Here we can see Bollinger's band expanding indicating the market increased volatility, meanwhile, the RSI indicator shows a level of 30 which means the price entering the oversold zone level which becomes an early warning probably a reversal zone.

OFpAwLGh.png


Disclaimer: CFDs are complex instruments and come with a high risk of losing your money.
 
Hello everyone, has a nice day, I wish all FPA forum members get success in their life.

Oil prices are still steady moving near 80 level prices on yesterday's market. oil price dropped to a low of 79.89 and rebound to 80.94.

News related oil citing to Oilprice, G& ministers agree to invest in natural gas and ongoing use fossil fuels.

XTIUSD Technical analysis

Oil price now traded at 80.92 based on XTIUSD chart FXOpen in Tradingview. Oil price recorded a high of 84.53 on 17 April then dropped again to near 80 level price.

In the daily timeframe, Oil prices now move above the MA line that now become dynamic support at roughly 79.75. Oil prices also move above the middle band line and here Bollinger band shows an uptrend market. Meanwhile, the RSI indicator shows a level of 60 which means the price is above the uptrend zone level.

In the hourly timeframe, oil prices are now consolidated near the MA line and middle band line. here Bollinger band starts to draw the flat line with a range high 81.51 and low 80.10. Meanwhile, the RSI indicator shows a level of 49 which means the price is below the downtrend zone level.

kOx7cmxE.png


Disclaimer: CFDs are complex instruments and come with a high risk of losing your money.
 
Hello everyone, still in the Ramadhan Kareem, probably one day left in this year.

Oil prices eventually break the 80-level price and declined to a lower level at 78.85 based on the XTIUSD chart FXOpen in Tradingview.

According to an analyst from Oilprice, oil declined because of fears of an interest rate hike and the climbing dollar. Instead responded downsized inventory, the oil market responded by strengthening US Dollar.

XTIUSD Technical analysis

Oil price yesterday dropped to a low of 78.50 and crosses down the MA line to try to reach the middle band line at 78.24. The price broke the psychologist level 80 level price and dropped to a lower level. Here Bollinger band still draws a wide range, which means the market in high volatility. Meanwhile, the RSI indicator shows a level of 53 which means the price is above the uptrend zone level.

In the hourly timeframe, we can see now oil price is moving below the MA line and the middle band line looking low at 78.44. Here we can see Bollinger band draws a wide range with a resistance-based upper band near 80.75 and support near 78.44. Meanwhile, the RSI indicator shows a level of 37 which means the price is below the downtrend zone level.

SNiVmgF7.png


Disclaimer: CFDs are complex instruments and come with a high risk of losing your money.
 
Hello everyone, have a nice day, happy eid for all muslims in the world, keep spirit to trade.

Oil price on the last week dropped to low 76.66 and successfully crosses MA line and middle band line.

Oil price record high 84.53 on 17 April then face consecutive decline to cross MA line and middle band line.

News related oil citing to Oilprice, President of Russia Vladimir Putin discuss OPEC+ output deal with a Crown Price Saud Mohammed bin Salman

They discuss in telephone like reuters reported, where both still want to coordinate oil supply in the market.

XTIUSD technical analysis

Oil price now traded at 77.63 based on the XTIUSD chart FXOpen in the Tradingview.

In the daily timeframe, the OIL price now moves below the middle band line and MA line, the price successfully crosses the critical support 80 level price on 19 April and dragged the price drop to a low of 76.66 on 21 April. Here we can see the Bollinger band line draws to narrow indicating lower volatility occurs, despite the daily range still being wide. On another edge, the RSI indicator shows a level of 49 which means the price is below the downtrend zone level.

In the hourly timeframe, oil prices now move above the MA line and middle band line indicating an uptrend signal. However, here we can see the Bollinger band draws a narrow range or we call the Bollinger band squeeze waiting for a breakout. The price still traded high of 78.21 and a low of 77.32 in the last 24 hours. Meanwhile, the RSI indicator shows a level of 50 indicating a neutral zone level.

xAKqG5IE.png


Disclaimer: CFDs are complex instruments and come with a high risk of losing your money.
 
Back
Top