fxoday
Recruit
- Messages
- 884
Hello everyone, entering the second day of this week in the forex trading market open.
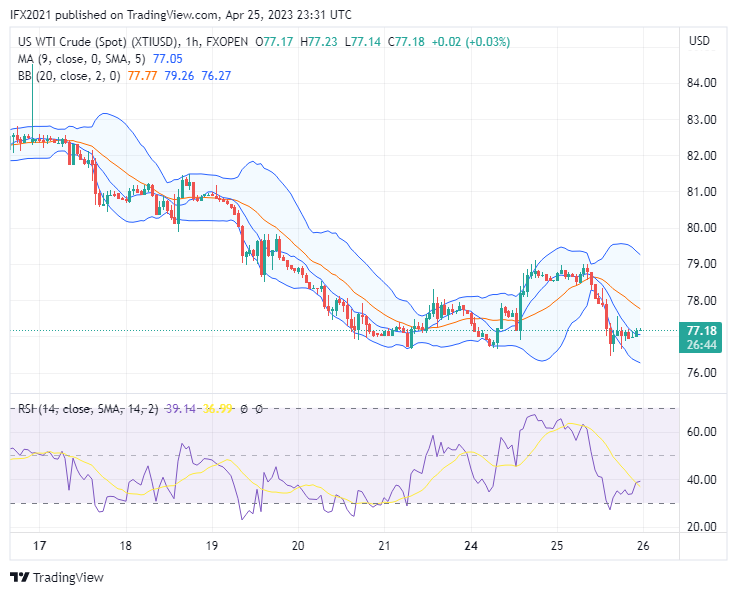
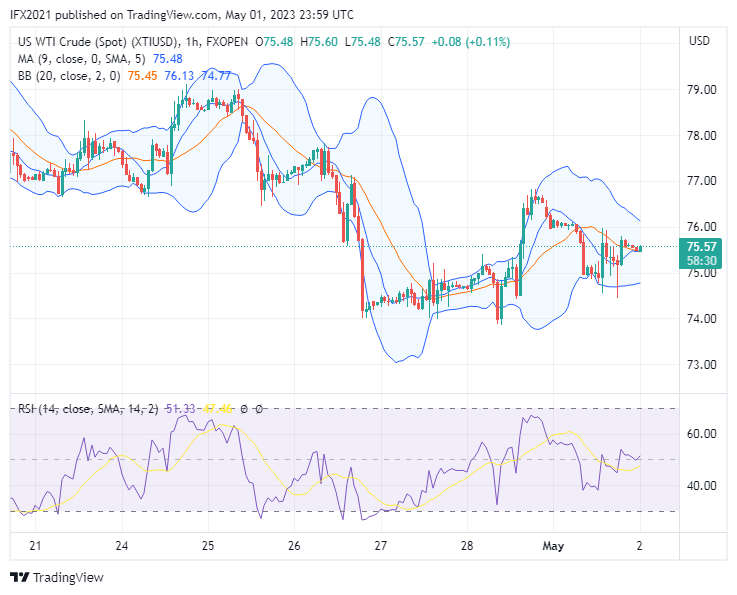
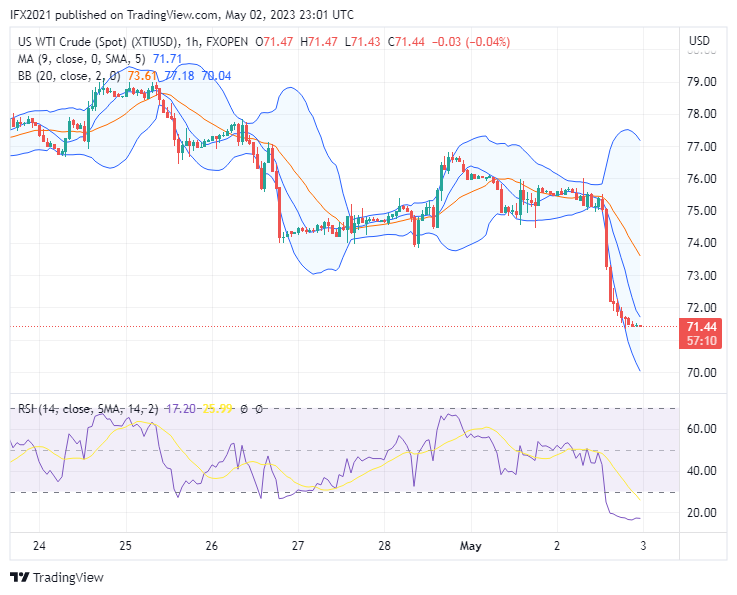
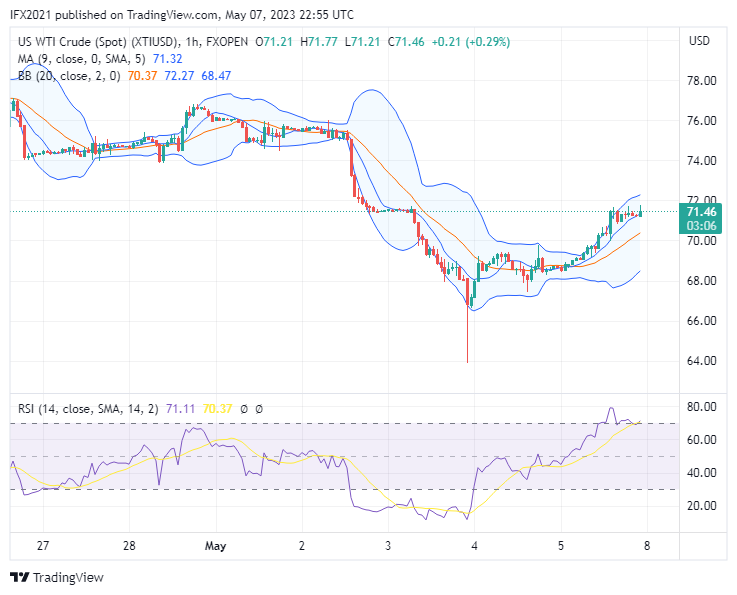
The oil price today is 78.53, the price tries to wake up and formed a bulls candle on yesterday's market with a high of 79.11 and a low of 76.66.
Russian oil export remains high despite production cuts, quoted from Oilprice. Russia's crude oil shipments continued to average a high of 3.4 million barrels per day (bpd) in the week of April 21 despite the 500,000 bpd production cut.
XTIUSD technical analysis
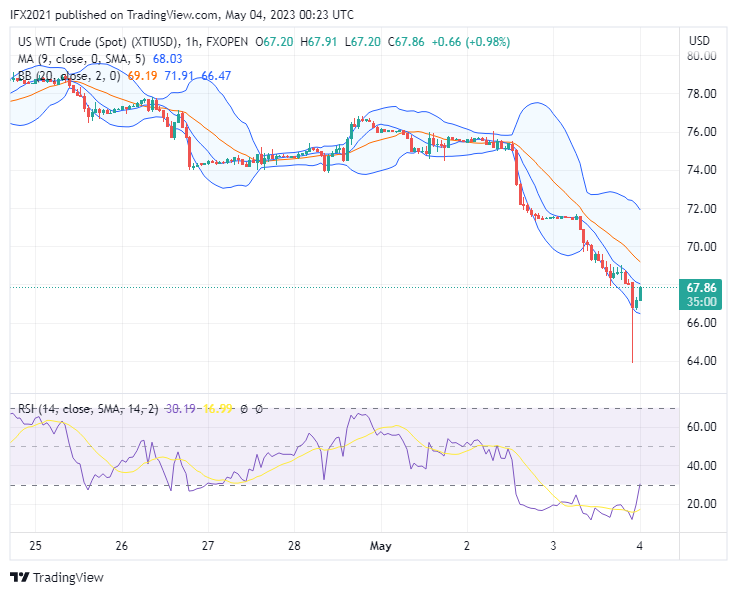
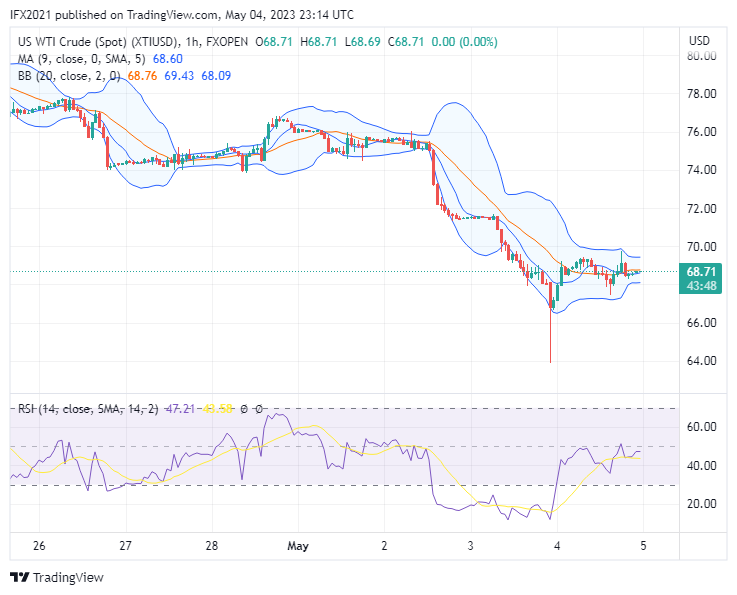
Oil price corrected near the 78 level price after dropping low 766.66. The price now moves below the MA line and middle band line indicating the price is in a downtrend zone level with a reversal pattern.
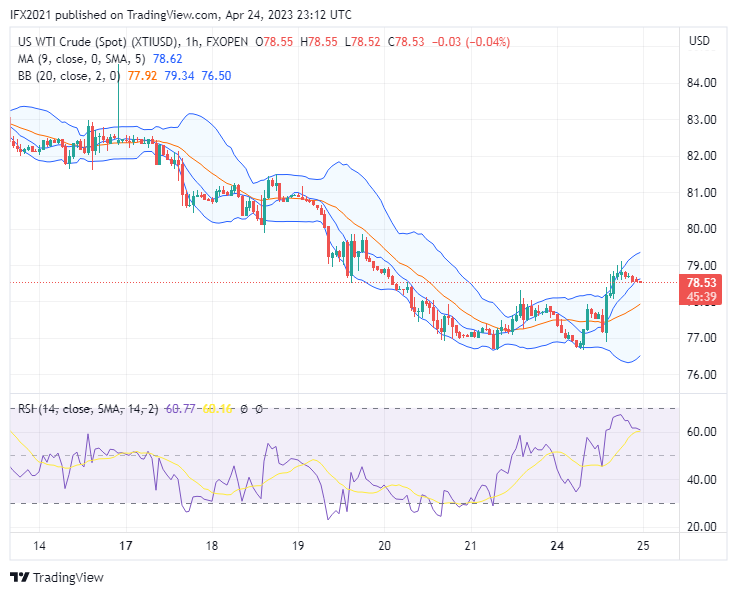
In the daily timeframe, the oil price tries to wake up and formed a bullish candle with a higher high. However, the price still moves below the MA line which becomes the resistance zone level near 79.50. Here we can see the Bollinger band draws narrowed indicating lower volatility. Meanwhile, the RSI indicator shows a level of 52 indicating the price is above the uptrend zone level.
In the hourly timeframe, the oil price breaks the upper band at the price of 78.11 and expanding bands. The price now moves above the MA line and middle band line. The RSI indicator shows a level of 60 indicating the price is above the uptrend zone level.
Disclaimer: CFDs are complex instruments and come with a high risk of losing your money.
The oil price today is 78.53, the price tries to wake up and formed a bulls candle on yesterday's market with a high of 79.11 and a low of 76.66.
Russian oil export remains high despite production cuts, quoted from Oilprice. Russia's crude oil shipments continued to average a high of 3.4 million barrels per day (bpd) in the week of April 21 despite the 500,000 bpd production cut.
XTIUSD technical analysis
Oil price corrected near the 78 level price after dropping low 766.66. The price now moves below the MA line and middle band line indicating the price is in a downtrend zone level with a reversal pattern.
In the daily timeframe, the oil price tries to wake up and formed a bullish candle with a higher high. However, the price still moves below the MA line which becomes the resistance zone level near 79.50. Here we can see the Bollinger band draws narrowed indicating lower volatility. Meanwhile, the RSI indicator shows a level of 52 indicating the price is above the uptrend zone level.
In the hourly timeframe, the oil price breaks the upper band at the price of 78.11 and expanding bands. The price now moves above the MA line and middle band line. The RSI indicator shows a level of 60 indicating the price is above the uptrend zone level.
Disclaimer: CFDs are complex instruments and come with a high risk of losing your money.