XTIUSD price analysis

Hello everyone, have a nice day, Ramadhan Kareem, happy fasting for all Muslims.

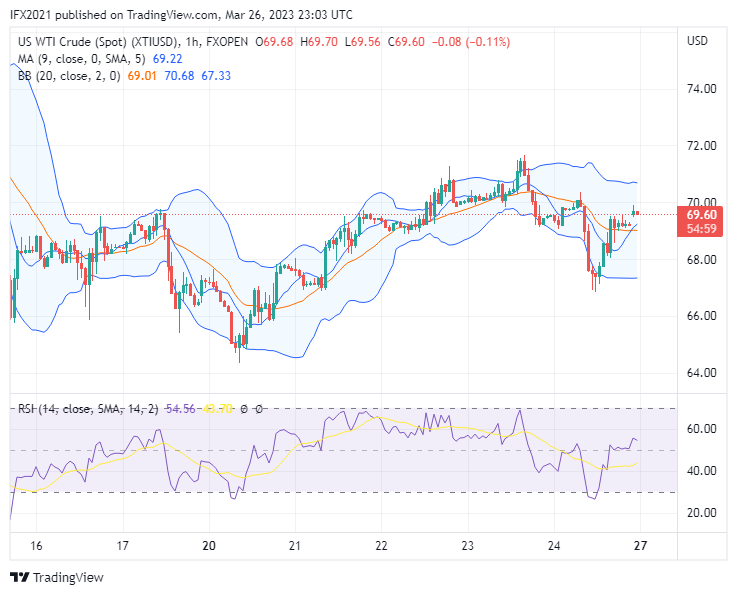
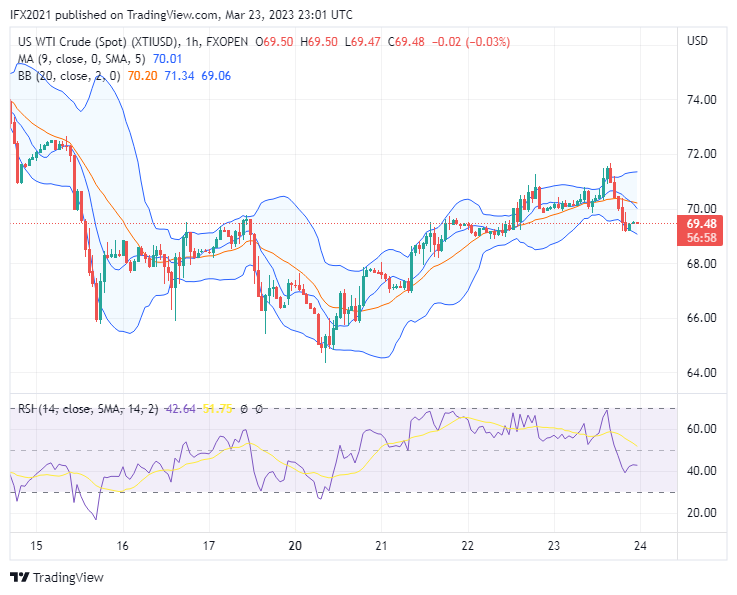
Oil prices dropped to 69 levels of price from a high of 71.66 yesterday. The price formed a bearish candle after hitting the MA line. However the price still yet formed a lower low.

News related oil, citing to Oilprice, EU ban Russian fuel leads to diesel glut in Asia. Asian refineries now have to compete with Russia for diesel sales, with weekly gasoil inventories at the Singapore hub hitting the highest level in more than a year last week.

XTIUSD technical analysis

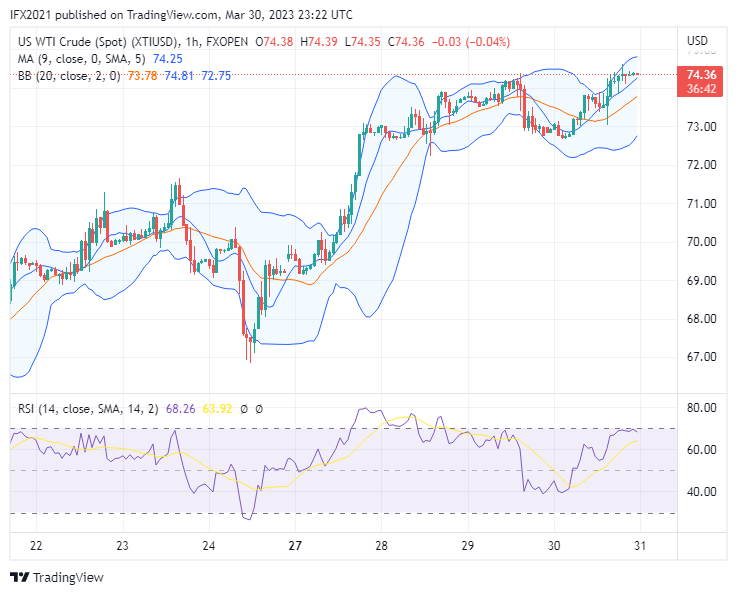
Oil price today is 69.48 based on the XTIUSD chart FXOpen in Tradingview. Oil prices dropped again after hitting a high of 71.66.

In the daily timeframe now oil price moves below the MA line and above the lower band line. Here we can see the Bollinger band still in wide distance upper and lower bands indicating high volatile market. The support zone near the lower band line at roughly 64 level price and the resistance zone based upper band at 82.60. Here RSI shows level 38 which means the price is below the downtrend zone level.

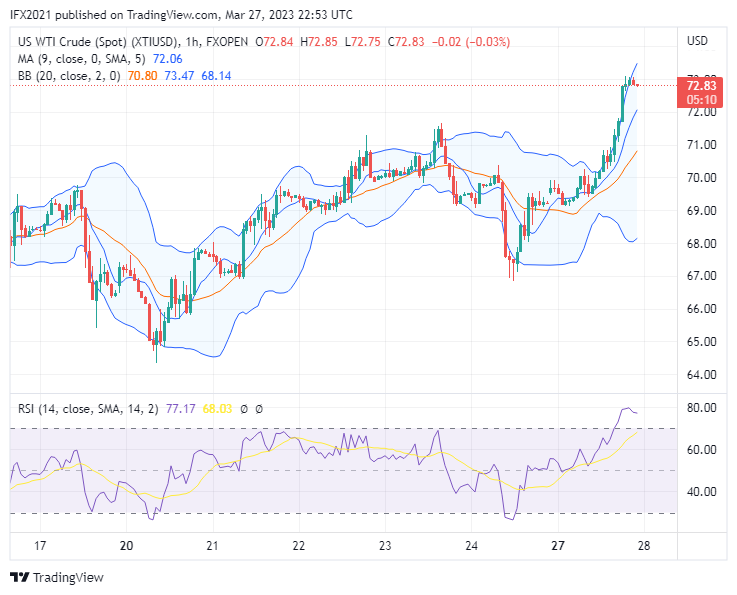
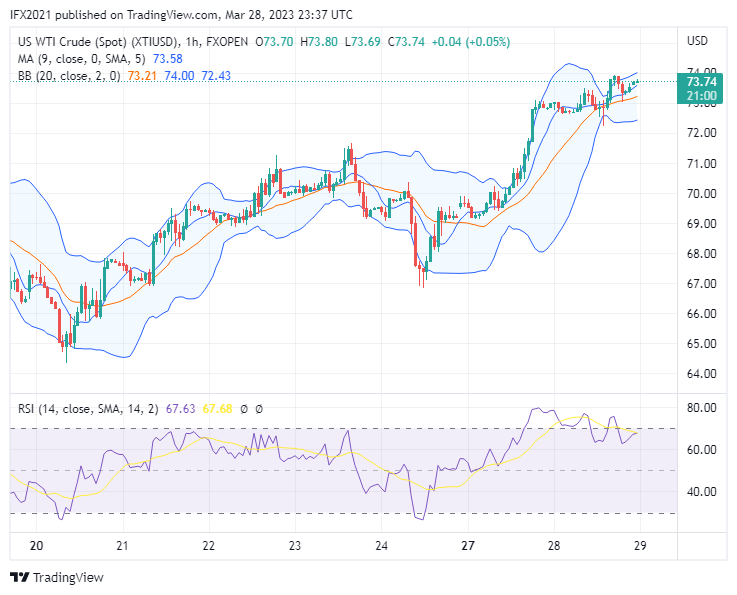
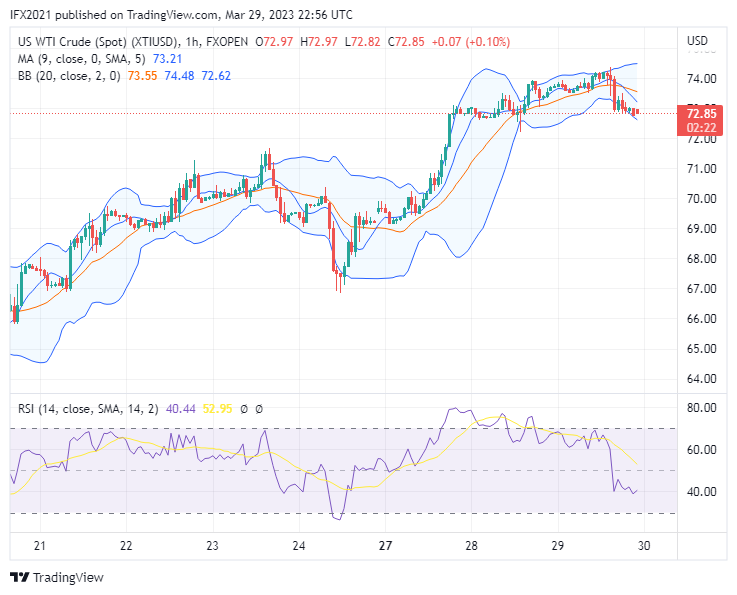
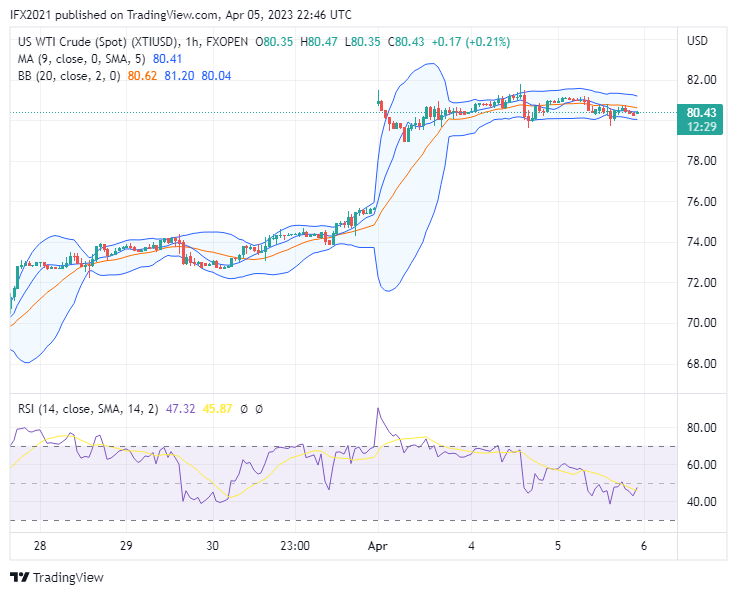
In the H1 timeframe, we can see oil prices now move near the lower band line. The decline seems to be weakened. Here Bollinger band expands indicating occurs increasing volatility, while RSI shows level 42 which means the price is below the downtrend zone level.

t0x6Xrkw.png


Disclaimer: CFDs are complex instruments and come with a high risk of losing your money.
 
Hello everyone, Monday market is beginning, always there is new hope in the new days.

Oil price now traded at 69.60 based XTIUSD chart FXOpen in the Tradingview. There is a small gap we can see in the H1 timeframe in the opening market.

News related to oil citing to Oilprice, Banking fears led to a major sell-off in crude oil futures this month. The heavy selling of crude oil and gasoline futures coincided with a move into precious metals.

silver and gold saw a net increase in long positions while all other classes of crude and crude products apart from heating oil and natural gas saw a net increase in short positions.

XTIUSD Technical analysis

Oil prices in the daily timeframe now move below the MA line which becomes the first dynamic resistance of oil prices. Oil touched the line on March 23 and rebound to a low of 66.85 on March 24. The price now moves in the trading range of 72 and 62. Here we can see Bollinger band draws to expand which means the market has high volatility. RSI shows level 39 which means still below the downtrend zone level.

In the H1 timeframe, we can see a gap occurs from 69.13 to 69.57. The price now moves above the MA line and middle band line, trying to reach resistance-based upper band near 70.60. Support zone-based lower band near 67.40. Here RSI shows level 55 which means above the uptrend zone level.

FKKdGR40.png


Disclaimer: CFDs are complex instruments and come with a high risk of losing your money.
 
Hello everyone has a nice day, hope all traders and members of the FPA community profitable day trading.

Oil price rallies up to rise more than 5% yesterday, now oil price traded at 72.83 based on the XTIUSD chart FXOpen in the Tradingview.

Why did the oil price rise while last week's oil price corrected sharply down? I read analysts said because fear banking is easing. The general sentiment in the oil market now seems to be that the fears of a wider financial crisis due to bank collapses and buyouts have somewhat eased. The easing of concerns follows an announcement by First Citizens that it would acquire deposits and loans from failed Silicon Valley Bank (SVB) to stabilize markets.

XTIUSD technical analysis

Oil price eventually break the MA line and tries to cross the middle band line now.

In the daily timeframe, the oil price at the time of writing moves near the middle band line above the MA line. Yesterday oil prices formed a bullish candle with a long body and small shadow, indicating a strong rally. Here Bollinger band draws a wide range which means the price move in a highly volatile market. While the RSI level shows level 49 which means the price is below the downtrend zone level.]

Oil price in the H1 timeframe we can see after the breakout upper band line near 70.29 the price strong rally and formed a high of 73.09. Now the price move near the upper band line above MA and the middle band line indicating an uptrend market, while the RSI level shows the level of 76 which means in the overbought zone level.


ebwe9G9k.png


Disclaimer: CFDs are complex instruments and come with a high risk of losing your money.
 
Hello everyone, have a nice day, the market still give new opportunoities to all traders catch a profits.

Oil prices continue to rise in yesterday's market, and the price at the time of writing at 73.74 based on the XTIUSD chart FXOpen in the Tradingview.

News citing Oilprice, U.S. crude oil production rose to 12.3 million bpd for the week ending March 17. U.S. production is now 800,000 bpd lower than the peak production seen in March 2020, but 700,000 bpd higher than this time last year.

XTIUSD technical analysis

XTIUSD price successfully crosses up the MA line and middle band line. Weak volume yesterday lead the price to form a small bullish candle with a small shadow.

In the daily timeframe, oil prices now move near the middle band line, resistance level based upper band near 82 level price, and support zone 63 level prices. Bollinger band wide range indicating high volatility in recent days. Meanwhile, RSI shows a level of 51 which means the price is above the uptrend zone level.

Oil price in the H1 timeframe, the price now moves near the upper band line above the MA line and middle band line. While Bollinger band draws narrow range market with high 74, and low 72 level prices. Here we can see RSI shows a number of 67 which means the price is above the uptrend zone level.

VPwFTanj.png


Disclaimer: CFDs are complex instruments and come with a high risk of losing your money.
 
Hello everyone, have a nice day, today the market still giving new opportunities to make a profit.

Oil price now traded at 72.85 based XTIUSD chart FXOpen in Tradingview. Oil price retraces to a low of 72.79 after hitting a high of 74.38.

News related oil citing to Oilprice, the banking crisis that started with the failure of Silicon Valley Bank (SVB) is putting major U.S. LNG projects at risk, as rising interest rates and supply chain issues introduce financial challenges that have already led to delays.

XTIUSD technical analysis

Oil price yesterday market formed a bearish candle after crossing the middle band line the price pullback and formed a low of 72.79. Now the price consolidated near the middle band line amid the indecision market. The Bollinger band line position still does not differ much from yesterday's band line. The resistance zone is roughly 82 and the support is roughly 63. Meanwhile, the RSI indicator shows level 49 which means the price is below the downtrend zone level.

In the hourly timeframe as short-term technical analysis, the oil price now figures out retracement the price now moves near the lower band line and tries to push down the oil price. Meanwhile RSI level shows the number of 41 which means the price is below the downtrend zone level.

sLFlXeEI.png


Disclaimer: CFDs are complex instruments and come with a high risk of losing your money.
 
Hello everyone, have a nice day, hope all traders obtain a good profit in this week.

oil price back to bullish on yesterday's market, now oil price landed at 74.36 based XTIUSD chart FXOpen in the Tradingview.

News related to oil, citing to Oilprice, OPEC+ To Stick To Its Current Oil Production Plans, despite the price crash in this week, In a meeting on Monday, delegates from the organization said that it would likely stick to its current production cut plan.

XTIUSD technical analysis

Oil prices now move above the middle band line and MA line, indicating the price sentiment in a bullish market. Yesterday oil prices formed a low of 72.66 and a high of 74.63. The price pullback is near 74.37 now. Here Bollinger band draws a wide range indicating a highly volatile market in this week. The resistance zone is still near the upper band at roughly 80-level prices and support is near 64-level prices. Meanwhile, the RSI indicator shows level 53 which means the price is above the uptrend zone level.

In the H1 timeframe, oil prices now move below the upper band line, the pairs move sideways at the last few candles in hourly indicating a weakening uptrend. Here Bollinger band draws to expand indicating high volatile market. Meanwhile, the RSI indicator shows a level of 68 which means the price is above the uptrend zone level near the overbought zone level.

WWXh0sIi.png


Disclaimer: CFDs are complex instruments and come with a high risk of losing your money.
 
Hello everyone. Monday market open, we see a big gap occur in oil prices.

Oil price now traded at 80.58 based on XTIUSD chart FXOpen in Tradingview, the gap with long-distance occurs on oil prices. in 31 march oil price closed at 74.26, and Monday market opened at 80.85, seems occurs a big movement when the market closed.

oil price jumped and break the resistance zone despite bank collapse still in mind, Citing to Oilprice, according the global head of commodities for Goldman Sachs said on Friday in a Bloomberg Television interview.

“We would argue you are buying the dip at this point,” Jeff Currie said, adding, “I have never seen a market sell-off that sharply, but retain a bullish structure.”

XTIUSD technical analysis

Oil price jumped to above 80 level price crosses the upper band line this morning. The price already landed near the resistance zone-based upper band. While gold prices even drop amid rising oil prices.

Now in the daily timeframe oil price move above the upper band line. and become concerned to pullback because the price is near the resistance zone level based on technical analysis. RSI indicator shows level 66 here indicating the price is above the uptrend zone level near the overbought zone level.

Going to the hourly timeframe, we can see a clearer gap occurs. Oil price crosses the upper band and breaks the line above the upper band line, now the price consolidated in 80 level price is still an indecision market, while RSI shows a level of 89 which means the oil price already entering the overbought zone level.

5Qs2rkPi.png


Disclaimer: CFDs are complex instruments and come with a high risk of losing your money.
 
Hello everyone, have a nice day, fall isn't mean dead, we can wake up and stand again.

Oil price yesterday traded in low movement, despite the price in consolidation above the upper band, however, the price not yet break 82 level price based on the XTIUSD chart FXOpen in Tradingview.

Commentary market from oil price writing OPEC+ shocked the market and make the price continue to climb. Saudi Arabia’s Energy Minister Prince Abdulaziz bin Salman warned traders that whoever gambled on the market would be sorry.

XTIUSD technical analysis

Oil price now traded at 80.34 based on XTIUSD chart FXOpen in the Tradingview, oil price move in narrow movement after large gap occurs in Monday market. Now the oil price still moves above the upper band line in the daily timeframe. While RSI shows a level of 65 indicating the price is above the uptrend zone level.

In the H1 timeframe, we can see oil price move in flat condition, the price move near the MA line and middle band line, meanwhile Bollinger band squeeze indicating low movement waiting for a breakout. RSI indicator shows a level of 63 which means the price is above the uptrend zone level near the overbought zone level.

zlhKVfpu.png


Disclaimer: CFDs are complex instruments and come with a high risk of losing your money.
 
Hello everyone, I wish all traders in this community become profitable traders as always.

oil prices still move not to differ much from yesterday's market, the price seems consolidated above the upper band line.

An analyst from Oilprice wrote, OPEC+ still has control of the oil supply in the market. OPEC+ stunned the oil market, announcing additional surprise production cuts until the end of this year and sending prices up by around $5 a barrel in a single-day surge on Monday.

XTIUSD technical analysis

Oil price today traded on 80.95 based on XTIUSD chart FXOpen in the Tradingview, oil price moved sideways after climbing high on Monday open.

In the daily timeframe, oil prices still traded above the upper band line, which this has become the first resistance of oil prices, usually if occurs gap, hence the market will move to recover the gap, however, this did not happen in oil prices till today, the price still move above upper band line. Here we can see MA line draws ascending which means the indicator shows an uptrend market. While the RSI level is 66 which means the price is above the uptrend zone level and below the overbought zone level.

In the H1 timeframe, oil prices now shaped flat market or sideways, we can see Bollinger band squeeze here, waiting for a breakout. The oil price moved in a small range between a high of 81.39 and a low of 79.72. While the RSI level shows the number of 57 which means the price is above the uptrend zone level.

OgaAHXs7.png


Disclaimer: CFDs are complex instruments and come with a high risk of losing your money.
 
Hello everyone, has a nice day, I wish all traders in the FPA community become profitable as always.

Oil prices still move steadily near 80 level prices, current based on the XTIUSD chart FXOpen, oil price traded at 80.43.

According to Reuters, Oil steadies as economic fears counter OPEC+ cuts, as we know OPEC+ surprised the market by announcing oil output cuts two days ago.

XTIUSD technical analysis

Oil prices are still steady moving roughly 80-level prices near the upper band line.

In the daily timeframe, we can see Oil prices still move in the trading range of 78.98 and high81.76. Here we can see the Bollinger band trying to expand indicating a highly volatile market, while the oil prices is still far above the MA line and the middle band line shows the price in bullish sentiment. The RSI indicator here shows a level of 64 which means the price is above the uptrend zone level.

In the H1 timeframe, oil price we can see the price in flat market conditions, here the prices formed a Bollinger band squeeze waiting for the breakout, while the RSI indicator shows the level of 47 which means the price was below the downtrend zone level.

MNTtxMnS.png


Disclaimer: CFDs are complex instruments and come with a high risk of losing your money.
 
Back
Top