fxoday
Recruit
- Messages
- 884
Hello everyone, have a nice day. I wish all trader's FPA forum members will be profitable and survive in the FX trading business.
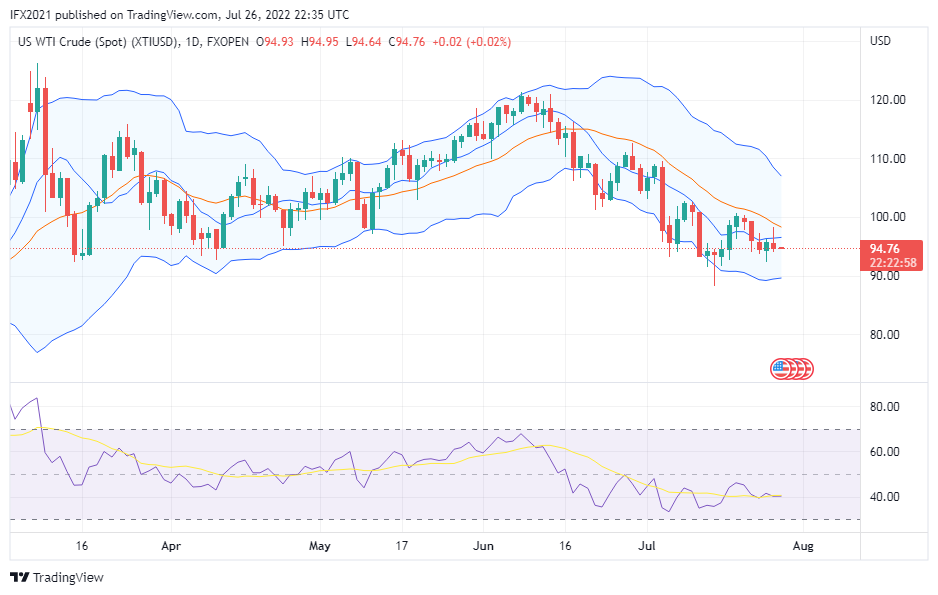
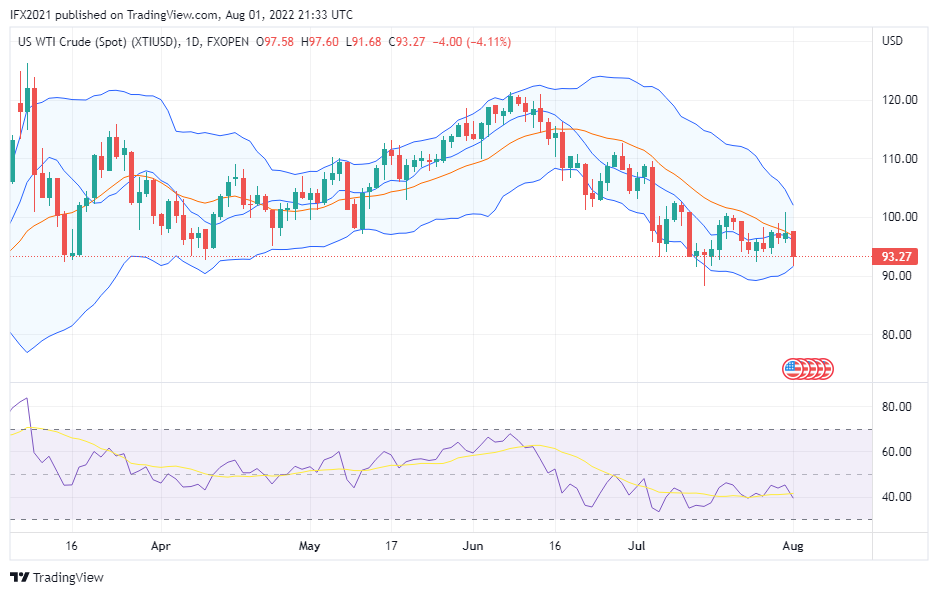
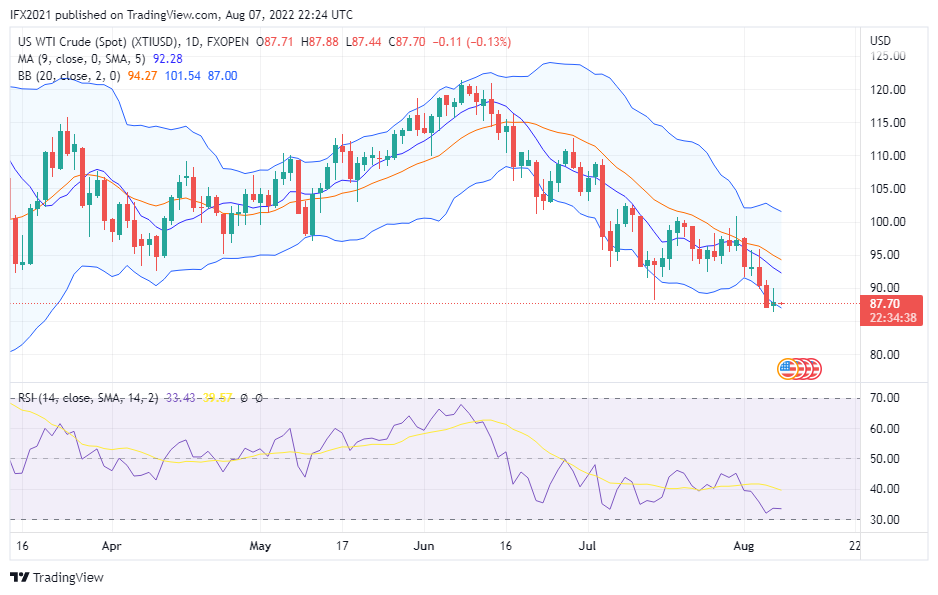
Oil prices today still move below 100 level price. At the time of writing oil price at 95.77 rise 1.29% according to XTIUSD chart FXOpen in Tradingview. Looks like the oil price still struggling to cross up the MA line, as now the price is near the line.
Today, there is a news related to oil from America. American's refinery probably profit won't last because of decreasing demand in summer, during two weeks fuel demand drops most 40% according to Oilprice.
XTIUSD daily timeframe, the price now near MA 9 line and formed bulls candle shaped small body. Yesterday's high was 97.63 and the low was 92.39. Bollinger band still on a wide range and price moves between the middle band and lower band indicates downtrend based indicator. RSI level shows41 cross up SMA line indicates the price trying to shift up.
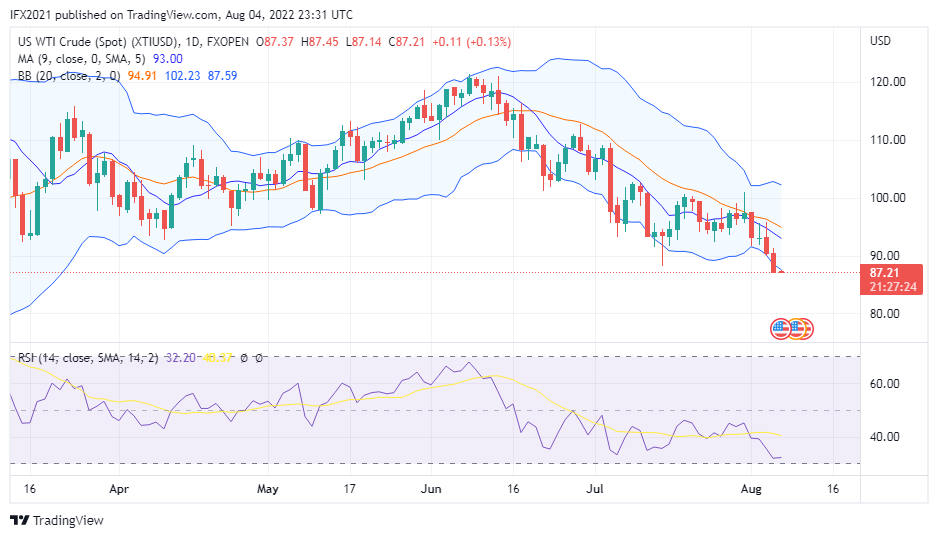
H1 timeframe, Oil price above MA line and Bollinger band expands as increasing volatility. RSI level 58 above the SMA line indicates an uptrend-based indicator in this timeframe.
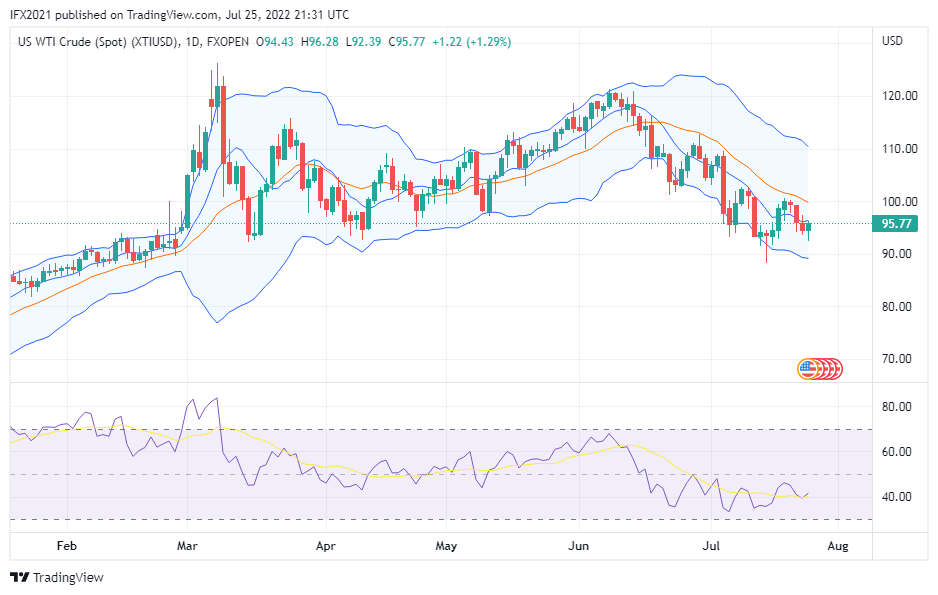
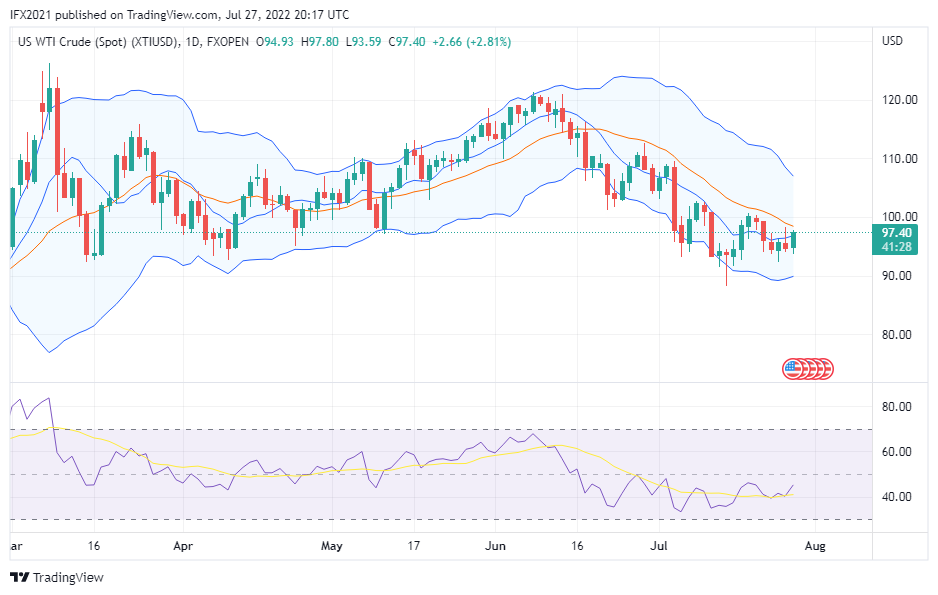
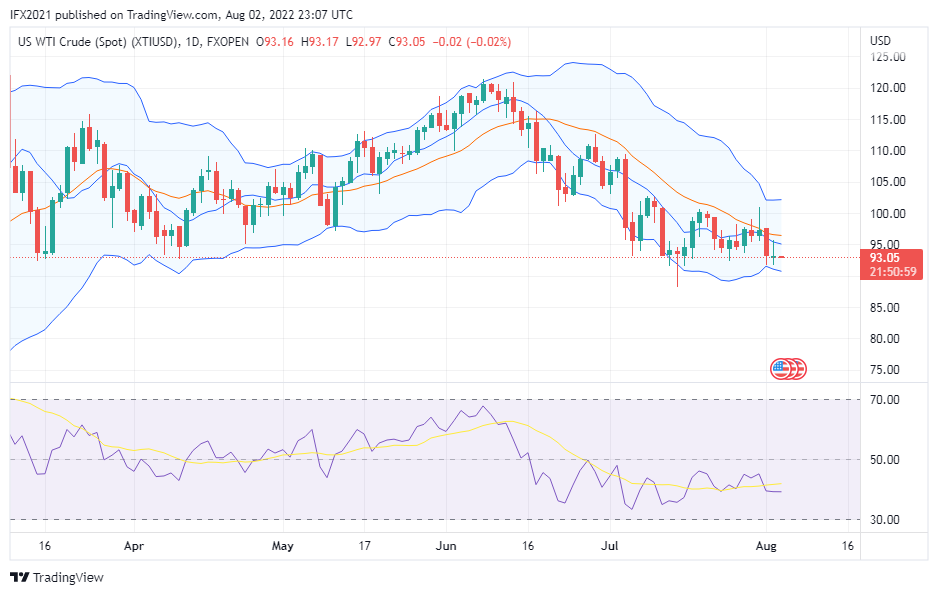
Oil prices today still move below 100 level price. At the time of writing oil price at 95.77 rise 1.29% according to XTIUSD chart FXOpen in Tradingview. Looks like the oil price still struggling to cross up the MA line, as now the price is near the line.
Today, there is a news related to oil from America. American's refinery probably profit won't last because of decreasing demand in summer, during two weeks fuel demand drops most 40% according to Oilprice.
XTIUSD daily timeframe, the price now near MA 9 line and formed bulls candle shaped small body. Yesterday's high was 97.63 and the low was 92.39. Bollinger band still on a wide range and price moves between the middle band and lower band indicates downtrend based indicator. RSI level shows41 cross up SMA line indicates the price trying to shift up.
H1 timeframe, Oil price above MA line and Bollinger band expands as increasing volatility. RSI level 58 above the SMA line indicates an uptrend-based indicator in this timeframe.