XTIUSD price analysis

Hello everyone, continue to today, with the new hope of making a profit from the forex market.

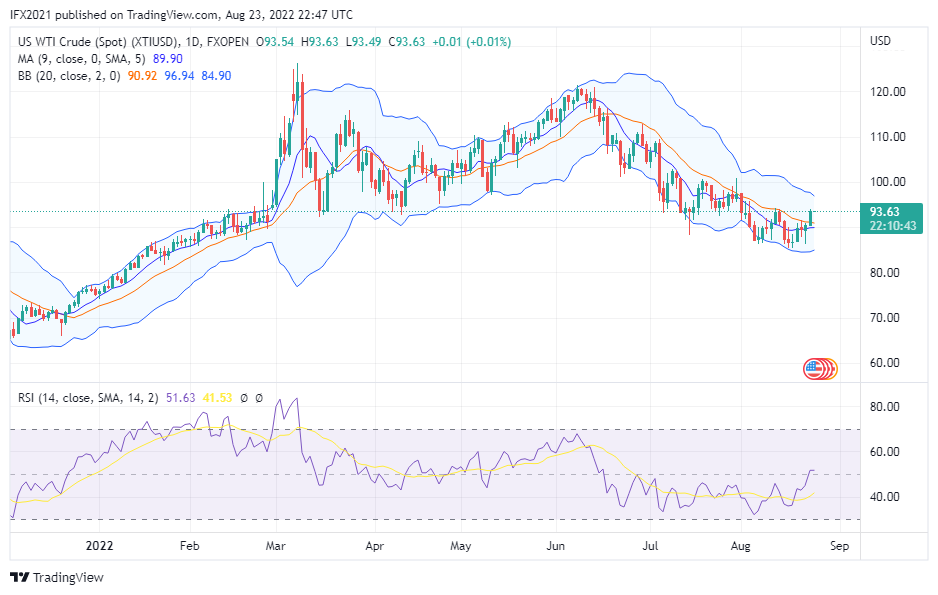
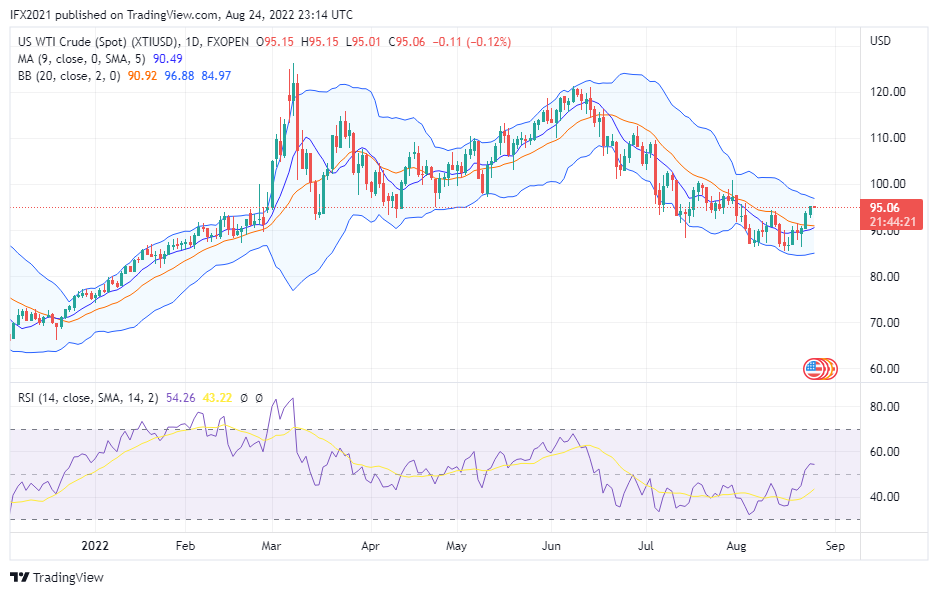
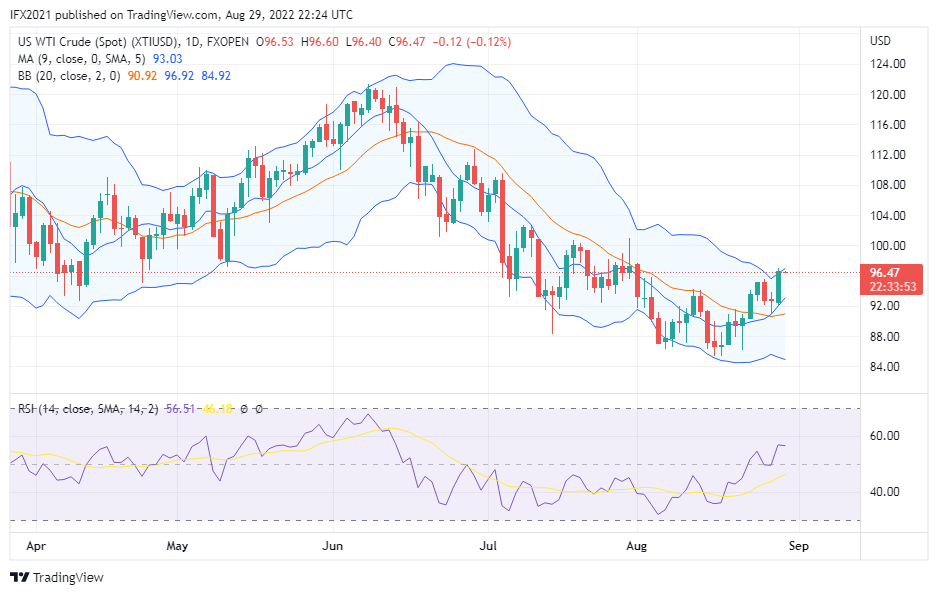
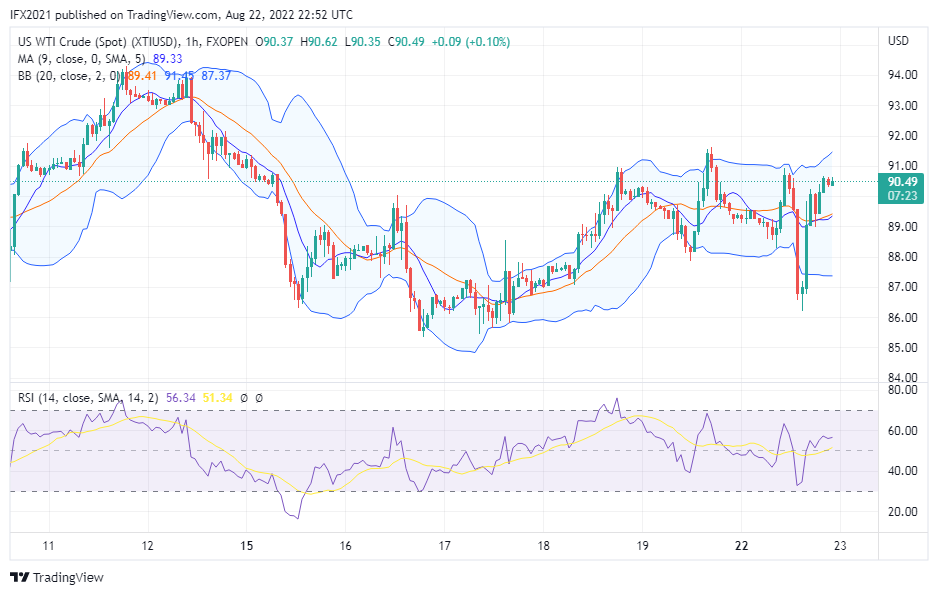
XTIUSD price moves high volatile on yesterday market. The price is now at 90.49 and formed yesterday's low of 86.22 and high of 90.94. Oil prices become highly volatile amid high energy costs in Europe.

News today related to energy citing to Reuters, U.S. crude inventory in the Strategic Petroleum Reserve (SPR) fell by 8.1 million barrels in the latest week to the lowest level in more than 35 years.

Stockpiles in the Strategic Petroleum Reserve (SPR) fell to 453.1 million barrels in the week to Aug. 19, according to the data. The 8.1 million-barrel draw was the largest since the end of April and brought inventory to the lowest level since January 1985.

XTIUSD Technical Analysis

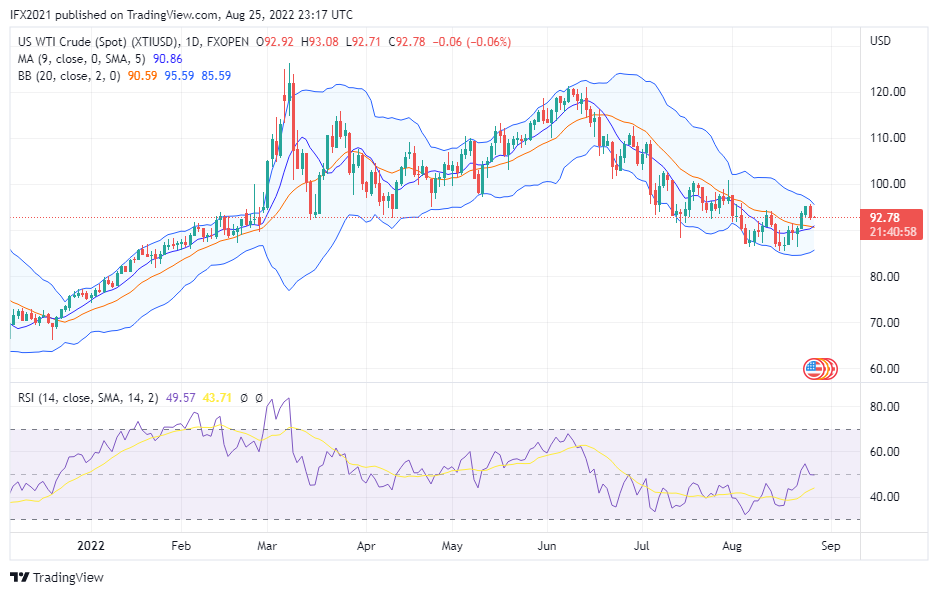
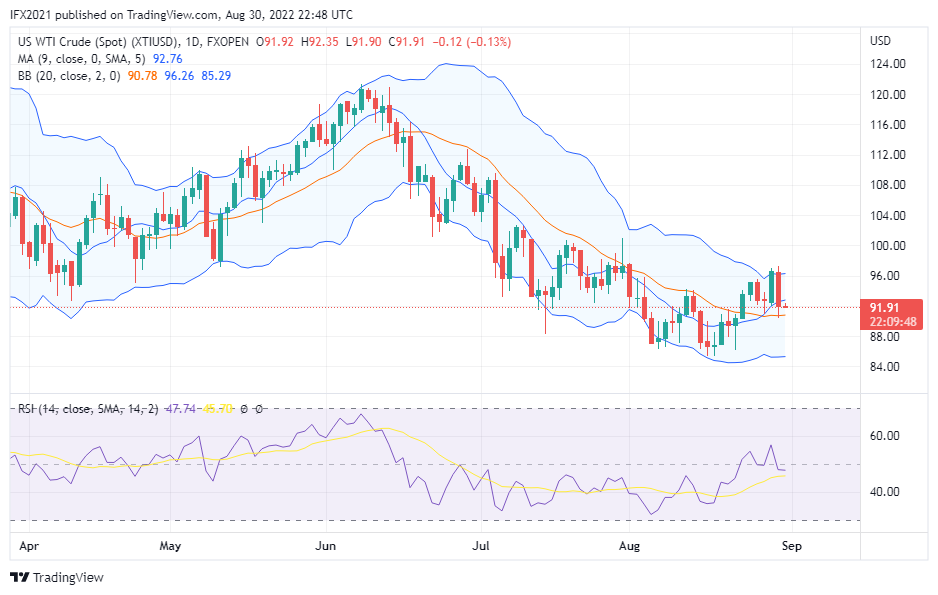
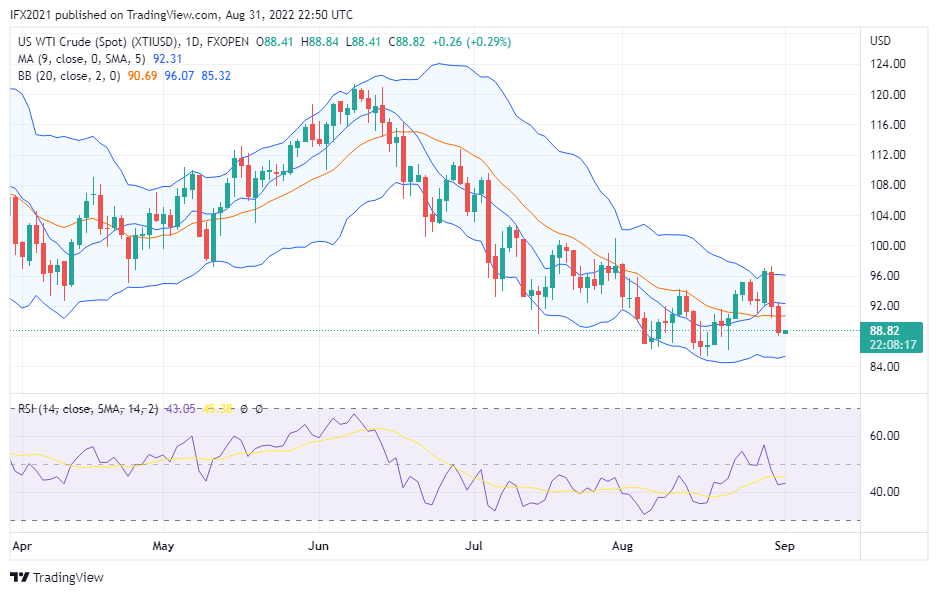
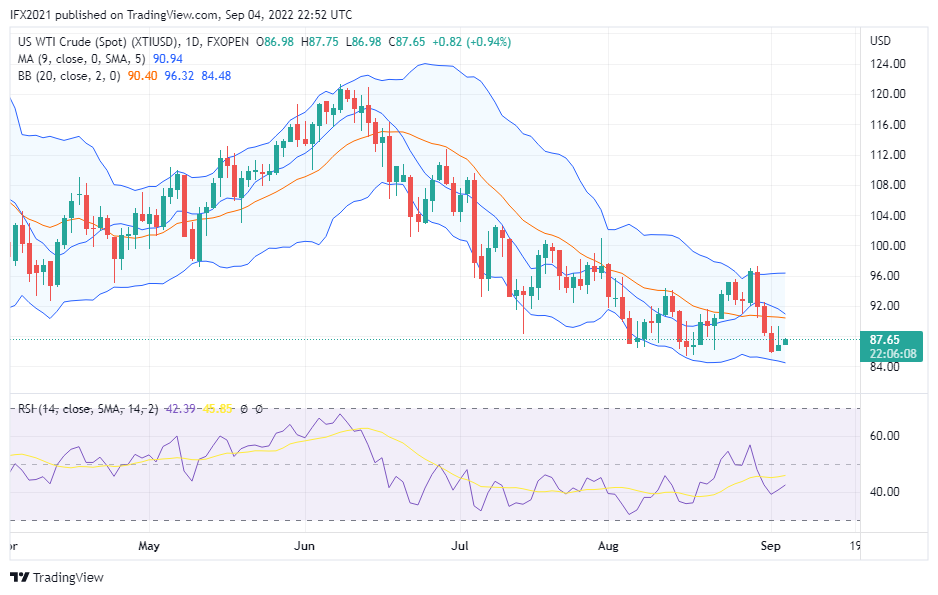
On a daily timeframe, the oil price is now still below the middle band line and trying to cross up the moving average. The black gold price yesterday drops to a lower level of 86.22, but then bounce back to 90 level price.

Bollinger band line still not much different, but there are indicators drawing to painting narrowed line, it is possible means as decreasing volatility on the market based daily timeframe.

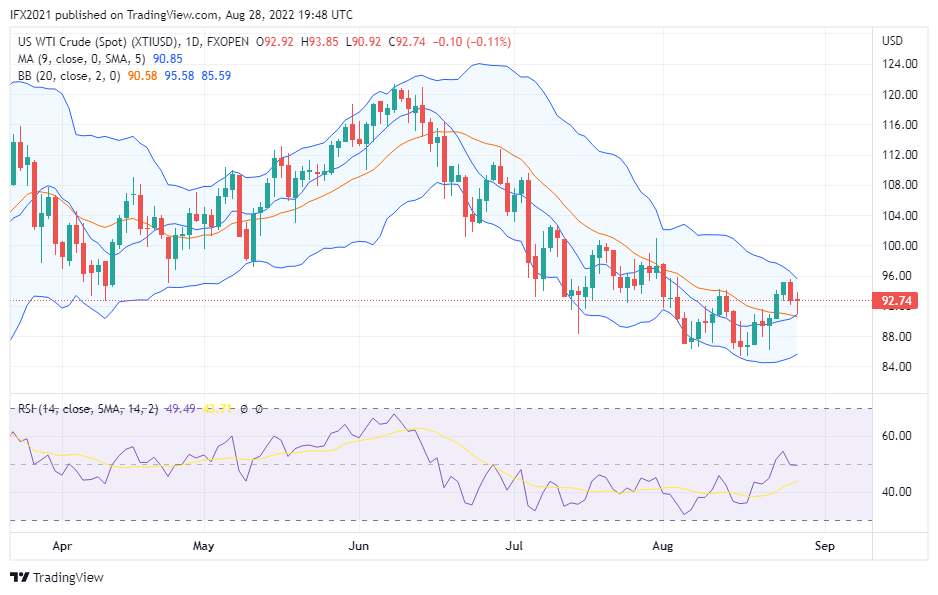
H1 timeframe, we can see oil price move rapidly and formed long body candle bearish and bullish. It's can be read after the price drops heavily then taking profit action dominates the market and make the price rebound and land to 90 level price.

Bollinger band looks expanding means there is increasing volatility, while RSI level 56 above the SMA line indicates the uptrend.

4QwPnq7v.png
 
Hello everyone, have a nice day, wish today we all make money in trading when money makes money, it will really make joy in life, but if still losing money, be patient, and still many hope for the future.

Oil price today again rising to higher price above 90 level price, at the time writing oil price formed new high 94.05, while the current price at 93.63 based XTIUSD chart FXOpen in Tradingview.

According to an analyst from Oilprice, oil prices soaring because OPEC+ leaked maybe to cut output once again, and Iran come back into the oil market.

Saudi Energy Minister Prince Abdulaziz bin Salman stated that amidst a possible revival of the Iranian nuclear deal and a growing disconnect between paper and physical markets OPEC+ will consider cutting production at any time and in different forms.

XTIUSD Technical analysis

XTIUSD price soared to form a new high at 94.05, oil price success to breaking middle band line and crosses up the line.

On the daily timeframe, the oil price is now above moving average 9 and middle band line looking for target upper band zone line roughly96.88. On this timeframe moving average is still below the middle band line, and not yet crosses up as buying signal. While Bollinger's band painting to narrow as means decreasing volatility. RSI value 51 above the SMA line indicates the uptrend.

H1 timeframe, oil price now in consolidation, there are few candles last hours move on the low trading range and not yet break high 94.05. Moving average line shows uptrend but the price move near the line means no trading signal, while Bollinger band expands, means high volatility occurs on the market. RSI value 68 near overbought zone level become attention for possible reversal.

eqvSHBS2.png
 
Hello everyone, I wish all traders and members FPA community get healthy and happy in their life.

XTIUSD price continues to rise, Oil price success to formed new high 95.21 and a low of 92.67 based on XTIUSD chart FXOpen in Tradingview. At the time of writing oil price record of 95.06 fell 0.12%.

Today news related oil, citing to Oilprice, India they cut import US crude by 50%, and increased imports to Russia to get discounted oil prices. It make Russia accounts for nearly 12.9% of India’s crude imports, while the U.S. share has tumbled to just 5.4%.

XTIUSD Technical analysis

Oil price success to formed new high above 90 level price to continue bullish, the price now 95.06 trying t reached upper band line to 96 level price.

On a daily timeframe, we can see Oil prices moving above the moving average and middle band line. It indicates an uptrend is still on the way, while the MA line trying to cross up the middle band line. RSI indicator value 54 above the SMA line indicates the uptrend. While Bollinger band line drawing to flat line indicates the price trying to move on trading range.'

H1 timeframe, the black gold price moves above a moving average and now near upper band line, on hourly timeframe oil price being high volatile move on trading range 92.77 and 95.50. Bollinger band slope up indicates an uptrend, RSI value 62 above SMA line indicates an uptrend.

hnmNas2y.png
 
Hello world, Friday market coming back, still left time to try to catch the chances in the FX market to make money. Hope all traders will profitable.

The oil price sink to 92.78, yesterday oil price shaped a high of 95.58 with a low of 92.11. The black gold still fails to reach 96 as the first resistance on yesterday's market. The price drops a few pips below the line and formed a bearish candle longer than the previous candle.

There are reasons the oil price dropped yesterday according to analysts from Oilprice, traders waiting for the Fed meeting to give a clue hike interest rate in September. Today Fed Chair Powell will speak, and many traders waiting to respond could make the oil prices back to high volatile.

XTIUSD Technical analysis

XTIUSD price drops from a high of 95.58 yesterday to 92.11 as a low price. The price fails to reach 96 level price. and formed a lower low, here there is selloff pressure after the price near the upper band line.

The daily timeframe shows the price now above the moving average and middle band line. MA line trying to cross up middle band line, but not yet success gives a buy signal. The Bollinger band shape does not differ much compared to yesterday's line. While the RSI value of 49 above the SMA line indicates the uptrend.

H1 timeframe, oil price below MA line and middle band line indicates downtrend based indicator. Bollinger band expands means increasing volatility, while an RSI value of 31 below the SMA line indicates a downtrend near oversold zone level.

a5Q1ZAWC.png


Risk disclaimer: CFDs are complex instruments and come with a high risk of losing your money.
 
Hello everyone, back to the chart. At the beginning week still motivated to get a better life.

Price analysis XTIUSD, now oil price moves 92.74, oil price formed high 93.85 and low 90.92. Oil price trying to push down and reached middle band line roughly 90.92 and then rebound and shaped long wick.

News-related energy still comes from Europe, high energy costs add to inflation woes, and it is predicted inflation rate more brutal in Q4.

XTIUSD Technical analysis

XTIUSD price now moves above the middle band line and moves the average line, still means an uptrend market based indicator. The resistance level could be roughly 95.42 and the support level roughly 85.51.

Looks Bollinger band line, paint to narrow, there are lower volatility occurs after the price drops 85.36 16 August. While the RSI indicator shows 49 above SMA line indicating the uptrend.

H1 timeframe, Oil price below middle band line but above moving average, there is consolidation price on this zone level. Bollinger band looks drawing flat indicates the price move on range 94 and 91 level price range. RSI shows 46 above the SMA line indicating an uptrend.

LMo2ouEM.png


Disclaimer: CFDs are complex instruments and come with a high risk of losing your money.
 
Hello everyone, have a nice day with always new hope to become better in whole life.

Today oil price moved price at 96.47 based on the XTIUSD chart FXOpen in Tradingview, Oil price back trying to rise after dropping to 90.92 a few days ago.

There are some reasons behind the rising oil prices. Potential production cuts by OPEC plus. New tension in Libya and Iraq concerned oil export.

OPEC+ producers, including Iraq, Venezuela, and Kazakhstan, have also signaled support for new production restrictions. Oil prices are still possible to rise.

XTIUSD Technical analysis

XTIUSD price now moves near the upper band line after the price bounce and touched the middle band, then the price back to rebound and landed on higher price.

Daily timeframe, we can see Oil price now move above moving average and middle band line means the trend market bullish still dominant. MA line crosses up middle band means uptrend market occurs.

However, the price now near the upper band needs to become considered, if the price break the upper band line, could lead the price to move higher to the 97 level target. RSI value 56 above the SMA line indicates the uptrend.

H1 timeframe, last few hours oil price move consolidation after sharply rising and formed strong bullish. Bollinger band expands means increasing volatility, while moving average below the price indicates an uptrend, RSI value 70 in overbought zone level become alert possibility reversal or retracement.

26oOPHSN.png


Disclaimer: CFDs are complex instruments and come with a high risk of losing your money.
 
Hello everyone, back to the market with new hope will be getting profit from every take action.

Yesterday oil price broke the upper band and shaped a new high of 97.25, however the oil price turned to a downturn and shaped the lowest low 90.36 before eventually the price now move to 91.91.

Some analysts said oil prices declined because of fears of economic slowdown, and fears high inflation growth could reduce the demand of oil.

XTIUSD Technnical analysis

Oil price now moves below moving average 9 but above middle band line, Oil price drops and touched middle band line here act as support zone level.

Long body candlestick formed on yesterday's market, means downturn oil price plunged deeply and shaped lowest low.

The daily timeframe we can see Oil price move near the middle band line. While Bollinger band still wide distance means volatility still high. RSI value 47 above the SMA line indicates uptrend in a downtrend market.

H1 timeframe bearish pressure starting to weak, the price move 9in consolidation, Bollinger band looks expands means high volatility occurs. RSI value 33 near SMA line no signal based indicator.

zc5E3vME.png


Disclaimer: CFDs are complex instruments and come with a high risk of losing your money.
 
Hello world, have a nice day with always new hope on new day.

Oil price continue to drops now at time writing oil price at 88.82. from high 92.45 yesterday based XTIUSD chart FXOpen in Tradingview. Oil price success to break middle band and now move below middle band and lower band line.

There are so many reason why oil price drops, global economic slowdown, Covuid restriction in China also included the list of reason the cause oil price drops.

Why lockdown in China impact to oil price, the reasonable because they as a big industry using oil, during lockdown activity was below average, decreasing oil demand.

XTIUSD Technical analysis

XTIUSD success to break the middle band line and bring the oil price sinks deeper. Oil price now 88.82 could reach low 84 as a lower band support level.

Daily timeframe, we can see oil price move and form a long bearish candle, which means high volatility occurs in yesterday's market. RSI indicator show level 43 below the SMA line indicating a downtrend. While the price is also below the moving average line and the middle band line tries to look at target 84 as a support zone.

H1 timeframe oil price wavy, now the price below the moving average and middle band line indicate downtrend, while Bollinger band line expands increasing volatility following a downtrend. RSI value345 above the SMA line indicates an uptrend signal in a downtrend market.

IEmZ1jv4.png


Disclaimer: CFDs are complex instruments and come with a high risk of losing your money.
 
Hello everyone, Friday has come, still left chances to try again today. If we get a loss yesterday, we hope to get a profit today higher than the loss.

Oil price now continues to decline and at the time of writing oil price is at 86.18 based XTIUSD chart FXOpen in Tradingview. Although not yet reached support 84 level price, however, oil price shaped low 85.74 yesterday.

Oil drops amids G7 discuss price cap to Rusia. On the other party, Russia will never sell oil to countries that sanction to price cap their oil. It is mean all countries that are included in G7 will never be eligible to buy oil from Russia.

XTIUSD Technical analysis

XTIUSD price continue to decline and formed a lower low. The price now moves near the lower band line with possible support-based lower band roughly 84 level price. Bollinger's band looks expanding, which means there is increased volatility. While an RSI value 39 below the SMA line indicates a downtrend not yet entering to oversold zone level.

H1 timeframe, the black gold move near moving average still downtrend market. However, there is a consolidation price in the last few hours. If the price break low possible to reach the support level, however, if break high 86 could bring the price land to 87.

602uXriw.png


Disclaimer: CFDs are complex instruments and come with a high risk of losing your money.
 
Hello everyone, back to the market now, Monday morning now, there are several trading pairs occurring gap like EURUSD, EURJPY, GBPJPY, etc.

While OIL price is now at 87.65 based on XTIUSD chart FXOpen in Tradingview. Seems the oil prices still move on trading range 96 high and low 84.

News related to energy today citing to Oilprice, Asia, Africa and the Middle East is expected to increase hydropower production to strive to meet the net zero emission goal. But what impact on oil price?

When demand decline could making the price drops again, and possible oil price gets a move low again to 84, however, no traders know the depth of the market, it depending on the market.

XTIUSD Technical analysis

XTIUSD price is now 87.65, high on 2 September at 89.32 and low at 86.83. Oil price trying to push price upwards near the middle band target 90 level price.

Daily timeframe, we can see oil price now below moving average 9 and middle band, the price near lower band line. RSI level 42 below the SMA line indicates the downtrend market has not yet reached the oversold zone level.

H1 timeframe, Oil price trying to crosses up moving average 9, means the price strive to upward with resistance target 89 level price. RSI value 50 above the SMA line indicates an uptrend-based timeframe.

A1fCY3Yq.png


Disclaimer: CFDs are complex instruments and come with a high risk of losing your money.
 
Back
Top