XTIUSD price analysis

Hello everyone, day by day goes through, the time cycles like a round table. The new day still gives new hope to everyone.

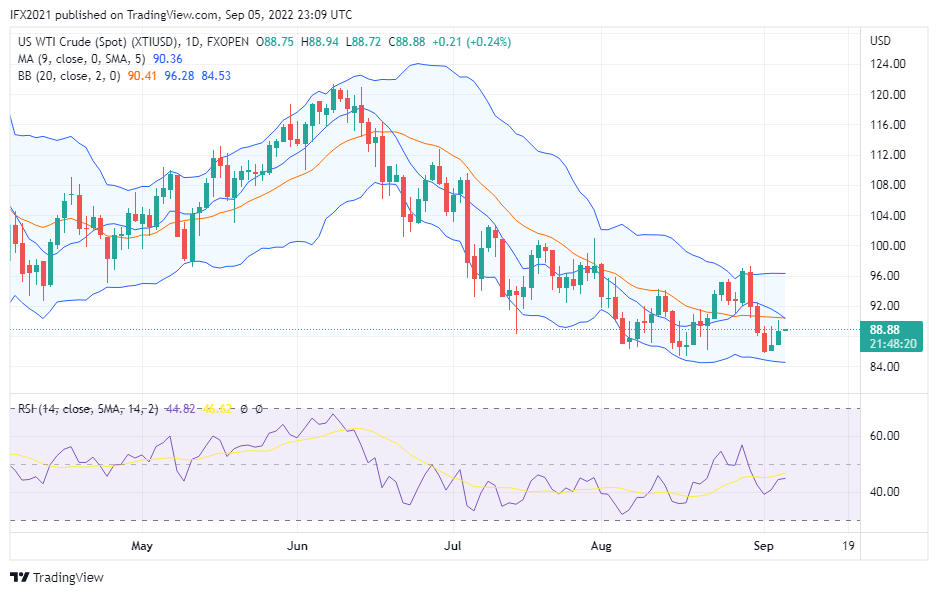
Oil price today move at 88.88 based XTIUSD chart FXOpen in Tradingview. Seems the oil price is still shy of a deep decline, and yesterday shaped a high 90.11 and a low 86.98. Oil price trying to reach the middle band line at 90.40 but there are rejections on its zone.

In today's news, citing to Oilprice, Europe's energy crisis not only hit households but also European Organization for Nuclear Research they will shut down some accelerators and could even idle the LHC to ensure grid stability in the nearby French and Swiss regions amid the severe energy crisis in Europe.

While another news OPEC + decided to cut the collective oil production target by 100,000 barrels per day (BPD) for October, despite Russia reportedly resisting such a move.

XTIUSD Technical analysis

XTIUSD price still moves below moving average 9 and middle band line, the price still moves between middle and lower band line indicates a downtrend.

Daily timeframe, yesterday price trying to rise but hold by resistance on the middle band and get rejection making the price drop to 88. Overall candlestick pattern formed lower high on three candlesticks means there is buying pressure trying to control. RSI value 44 below the SMA line indicates a downtrend.

H1 timeframe, Oil price move below moving average 9 but above middle band line, uptrend weak occurs based indicator. resistance level 89.80 based on upper band and support 87.60. While an RSI value of 53 below the SMA line indicates a downtrend.
e0Al4P9n.png


Disclaimer: CFDs are complex instruments and come with a high risk of losing your money.
 
Hello everyone, have a nice day, still left so much hope for the future, so don't fall into desperation.

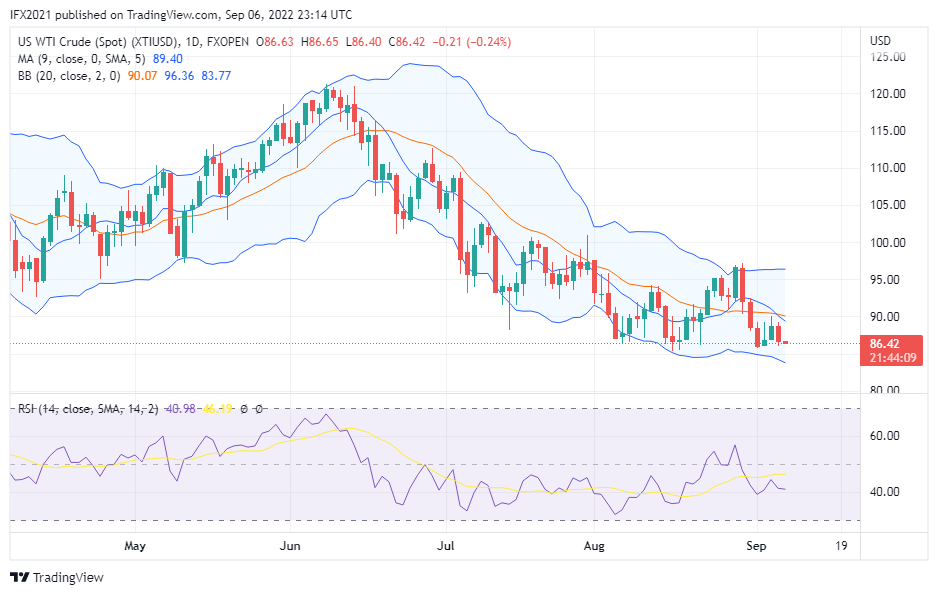
Oil price today 86.42 based XTIUSD chart FXOpen in Tradingview. The oil price drops from a high of 89.21 and formed a low of 85.96. Seems the oil price is still not get impacted by the cut in oil production by OPEC +.

Another reason why oil price drops again is that Russia resists keeping oil production. However still possible the price will rise as OPEC + is expected on 90.

News related energy in UK there are energy price soaring could make 60% Manufactures closed. The bill electricity rise 100% impact to companies.

XTIUSD Technical analysis

Oil price now below moving average 9 and middle band line. The black gold price move between the middle band and lower band indicates still in a downtrend.

Daily timeframe, we can see oil price now move near low 85.72 that occurs on 1 September. It is mean the price now moves on the support zone level price. Bollinger band expands with lower band target price 83.45 and resistance 96. RSI value 41 below the SMA line indicates a downtrend.

H1 timeframe, oil price move in consolidation, the price still below MA 9 indicates weak downtrend occurs, and MA line painting into flat means sideways market at the moment. RSI value 42 above the SMA line indicates uptrend trying to control based indicator.

JHjEJdnQ.png


Disclaimer: CFDs are complex instruments and come with a high risk of losing your money.
 
Hello everyone, back again to the market with new hope. I hope all FPA traders will increase their money from trading.

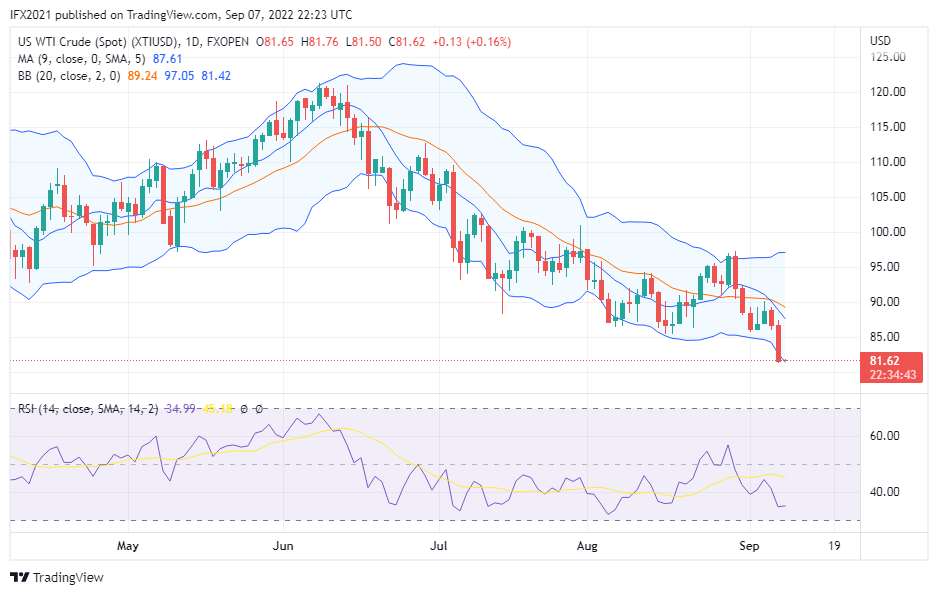
The oil price drops heavily to 81.62, and yesterday oil price from a high of 87.42 to and low of 81.29. Although OPEC+ cut oil production but seems not enough to control oil price move to 90 level price. There is some reason why oil continues to drop, citing oil price, Iran back to the oil market could lead to oil price drops to 65.

There is another piece of news, new UK Prime Minister Liz Truss is against windfall tax on oil and gas companies, she said it will make investors avoid investing in the UK.

XTIUSD Technical analysis

XTIUSD's price now moves below the moving average and successfully breaks the lower band line. Oil price heavily drops and formed a lower low on yesterday's market. The high price at 96 formed on 30 August and the low price at 81.29 formed on 8 September.

On a daily timeframe, we can see oil prices now move outside of the lower band, which means high volatility makes the price successfully breakout the lower band. RSI value 34 still indicates the downtrend, however, the price outside the lower band could retrace before continuing.

H1 timeframe, oil price move below MA line and middle band indicates strong downtrend occurs, Bollinger band look expanding means high volatility, while RSI value 23 indicates the price in oversold zone level as early warning possible retracement or reversal.

mGtImku3.png


Disclaimer: CFDs are complex instruments and come with a high risk of losing your money.
 
Hello everyone, the Friday market has come, the last day forex market gives opportunities to catch all chances.

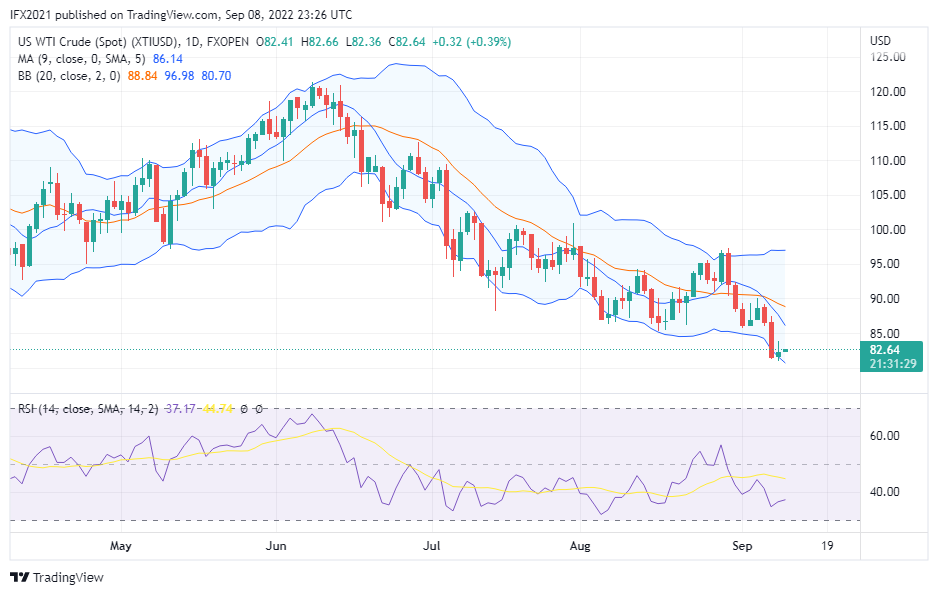
Oil prices now move near the lower band and trying to wake up. Yesterday market XTIUSD prices formed a high 83.83 and low 80.93, now price at 82.64.

News related to oil citing to Oilprice, the Oil industry in North America growing faster than expected, while Europe still fears a recession that could move to deep amid soaring energy.

XTIUSD Technical analysis

XTIUSD price still moves below 90 level price, now the price at 82.64 move in correction time after drops low 80.93.

In the daily timeframe, we can see oil prices are still below the moving average of 9 and the line slope down indicates a bearish market. There is increased volatility seen from expanding the Bollinger band line. If the price successfully breaks lower point, could lead to oil prices dropping lower. RSI value 36 below the SMA line indicates a downtrend yet entering to oversold zone level.

H1 timeframe, in short-term analysis oil price move in a consolidation phase, there is decrease volatility seen from narrowed Bollinger band. The price now moves below the moving average of 9 means a downtrend, but the price is still consolidated in the middle band line, support zone 81.47, and resistance zone 83.53 in a short-term hourly timeframe. RSI value 46 very thin above the SMA line indicates a weak uptrend signal.

xL1g7Ye4.png


Disclaimer: CFDs are complex instruments and come with a high risk of losing your money.
 
Hello everyone, Monday has come, this week all traders will try to catch the profit from the market, and hopefully, all traders making a profit.

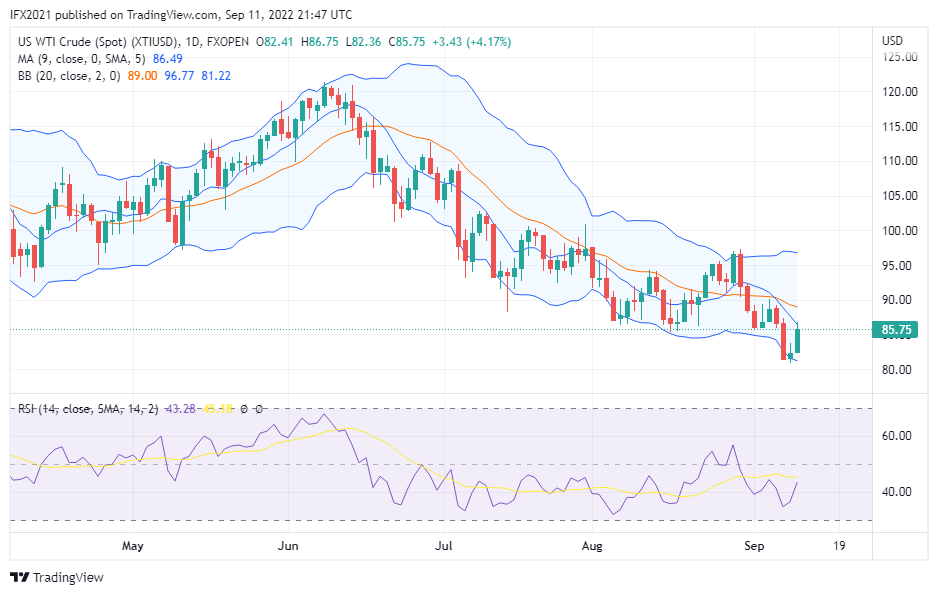
XTIUSD's price is now at 85.75 it is a formed bulls candle. oil price is now near moving average 9, this is a resistance zone based moving average when position price is below the line.

Oil price unsuccessfully to break low point 80 level price and get a rejection at lower band level make the price bounce to a current level price.

News tied about oil, British Columbia suspends permits for oil firms because of persistent drought. The goal is to reduce oil firms taking water from the river.

Another news, citing to Oilprice, although Europe banning Oil from Russia, but in fact still hard to be done. The EU’s reliance on Russian energy is still extremely high, and cutting its energy ties with Moscow doesn’t seem an easy task at all.

XTIUSD Technical analysis

Oil price moved to rise 9 September and formed a high 86.75, and the price trying to cross up to moving average 9, there are bigger volumes after the price get rejected on the lower band.

Daily timeframe, we can see oil price near moving average 9 and below middle band line, next if price break moving average will trying to reach middle band as next resistance. Strong resistance-based upper band roughly 96.88 and support level roughly 80.75. Here RSI value thin below the SMA line indicates a downtrend.

H1 timeframe, different perspectives can be viewed where the price move above moving average 9 trying to crossing down the line. Bollinger band expands there is increasing volatility occurs. If the price drops the next target is roughly 84.90, and 87.12 is the next rising target. RSI value 63 below the SMA line indicates a sell signal-based indicator.

xHF0Ygox.png


Disclaimer: CFDs are complex instruments and come with a high risk of losing your money.
 
Hello everyone, have a nice day, wish all FPA members to become profitable traders in the forex market.

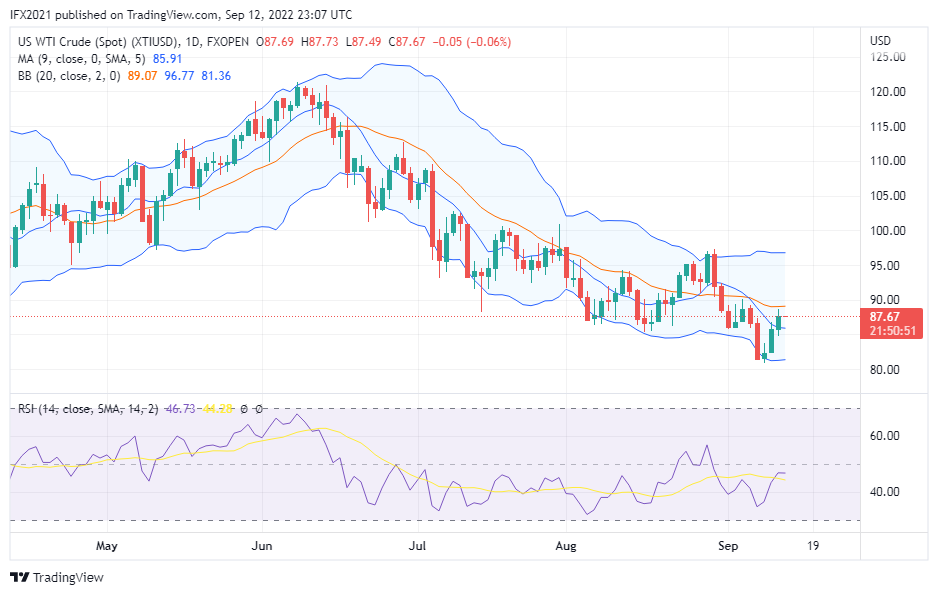
Back to the oil market. Oil price rise to the current price of 87.67 based XTIUSD chart FXOpen in Tradingview. Oil price successfully crosses up moving average 9 and move to middle band line zone level. But there are rejections on its line.

Analysts said oil prices rise roughly 2% because the Iran deal fades, and the market looking at tight supply, Market will focus on Europe’s coming ban on Russian oil and tight supply fears.

XTIUSD Technical Analysis

Oil price rise and shaped a bull's candle to form a higher high. Yesterday's low oil price was 84.77 and the high formed high of 88.68, Oil prices start to rise on 8 September after dropping to a low of 80.93.

Daily timeframe, we can see the black gold price now above moving average 9 and below the middle band line. The price indicates an uptrend in a trading range between the middle and lower bands. 89.10 is crucial resistance in the near future, if the breakout could lead to oil prices rising higher.

Next resistance could be 96.88 near the upper band line, while support zone 81 near the lower band line. RSI value 46 above the SMA line indicates the uptrend.

H1 timeframe Oil price moves weakly below the moving average, and Bollinger band drawing to narrow means there are decreasing volatility. If the price continues to rise 88.98 is resistance near term, and support is 85.08. While the RSI value of 63 below the SMA line indicates a downtrend starts.

KRlWkuPg.png


Disclaimer: CFDs are complex instruments and come with a high risk of losing your money.
 
Hello everyone, Wednesday has come, still much hope for the future.

Oil price yesterday moves still on the previous trading range, although shaped new high at 88.89 but only a few pips above previous high 88.68. Yesterday's low at 84.65 formed the lowest previous low at 84.77.

News related to oil today, citing to Oilprice, China, and Russia will disrupt US dollar domination in the oil market. The big company Gazprom and China National Petroleum Corporation agreed to switch payments to Rubel.

XTIUSD Technical analysis

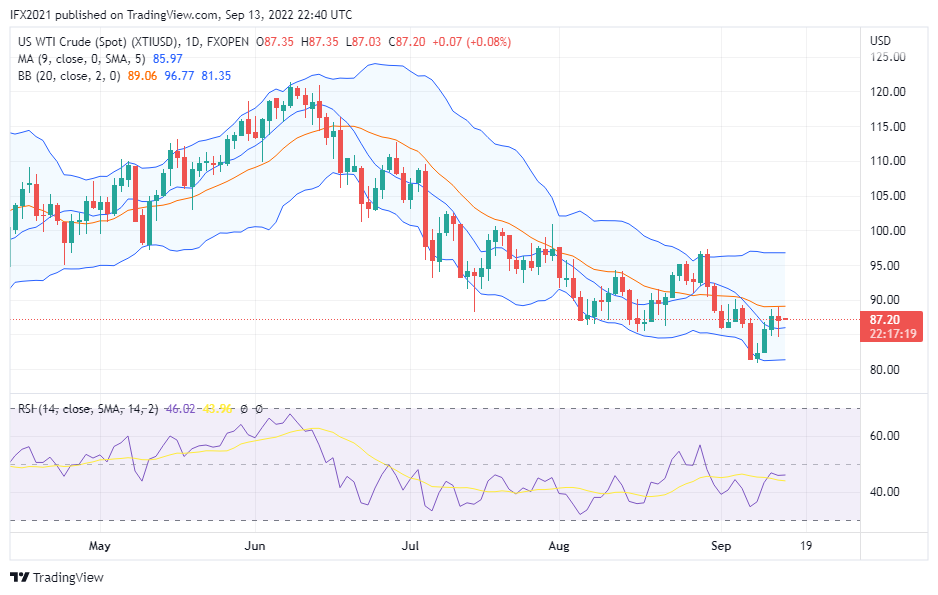
Oil price now 87.20 based XTIUSD chart FXOpen in Tradingview. Oil price yesterday try to cross middle band but face rejection on the line and retrace to lower level price as seen.

Daily timeframe, oil price now above moving average 9 but still below middle band line. The black gold prices still move between the middle and lower band zone levels. While the RSI value of 46 above the SMA line indicates the uptrend.

H1 timeframe, oil price move near the middle band and above moving average 9, however MA 9 form slope down line indicates a downtrend. While resistance is roughly 89 and support is roughly 85.60. RSI value 50 horizontally to SMA line indicates no signal or neutral zone level.

L2nagnU5.png


Disclaimer: CFDs are complex instruments and come with a high risk of losing your money.
 
Hello everyone, have a nice day always there is new hope for the future.

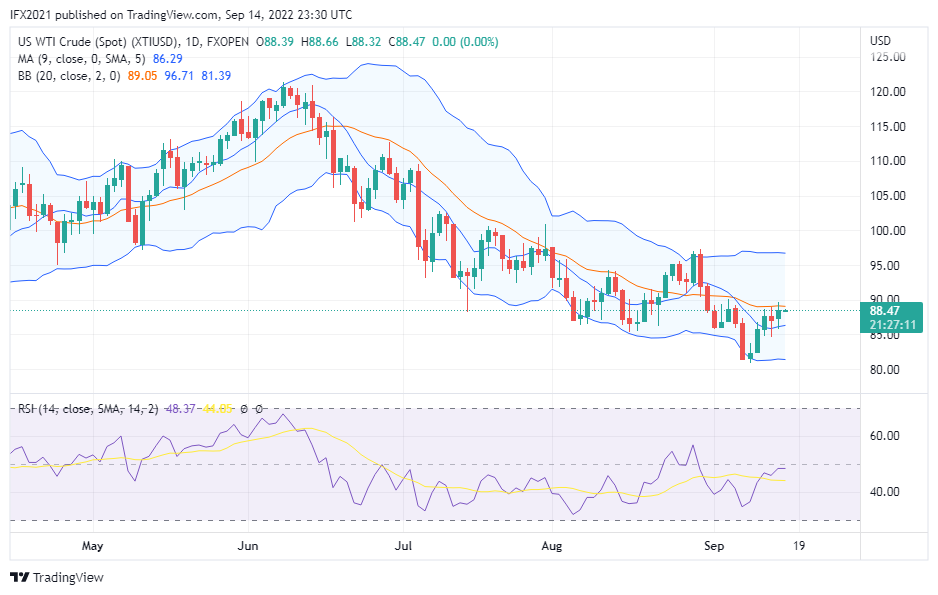
Oil price now 88.47 based XTIUSD chart FXOpen in Tradingview. Yesterday oil prices tried to cross up the middle band line and formed a high of 89.61. However, oil price still moves below 90 level price and gets a rejection on the line. Yesterday's low was 85.73 and touched the moving average 9 lines.

News today related to oil. The analyst said if rising oil price crosses the economic wire, demand growth, US crude inventory data, inflation indications, and the impact of China’s COVID lockdowns.

While drought in North America, Europe, and China make other disasters to the water supply of millions of people.

XTIUSD Technical analysis

Oil prices still move between the middle band and the lower band. The price moved above moving average 9 and below the middle band line. Although yesterday the price success to break the middle band line, but still get a rejection and the price declined to 88.47.

Daily timeframe, oil price move formed lower high on three days. Based on MA 9 oil prices tend in a bullish market, however, the Bollinger band line flat indicates the trend possible move trading range swing high 96 and swing low 81 level price. RSI value of 48 above the SMA line indicates a buy signal during a downtrend market.

H1 timeframe, oil price move cross down moving average 9, looking for middle band line zone prices 87. Bollinger band expands, there is increasing volatility, while RSI value 54 below SMA line indicates in uptrend give a sell signal.

I5UMlyOk.png


Disclaimer: CFDs are complex instruments and come with a high risk of losing your money.
 
Hello everyone, have a nice day, continue business today, and wish all traders members FPA will become profitable.

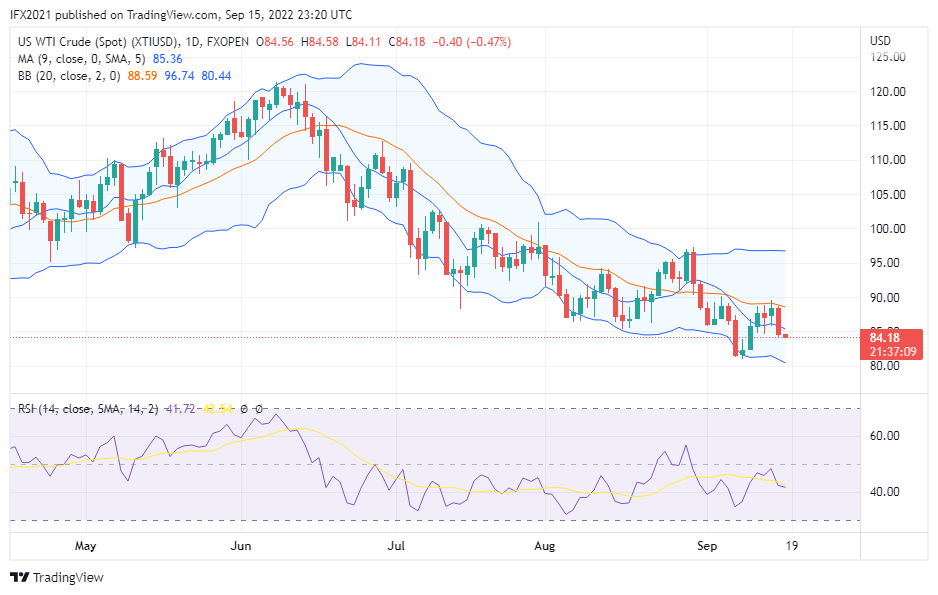
Oil price still drops again yesterday, the price can't reach 90 level price but declined to the current price of 84.18 based on the XTIUSD chart FXOpen in Tradingview.

This is interesting because a few days ago OPEC + cut their oil production and expected the price will roughly 90, but in fact, the oil price still fell below expectation.

An analyst from Standart Chartered says as a quote from Oilprice if the oil price plummets not mean broker, but it is because of surplus oil supply, where supply excess with transferring 0.83 million barrels per day (mb/d) into commercial inventories.

XTIUSD Technical analysis

Oil price still hard to reach 90 level price, even the price drops to 84.10 crossing down moving average 9 and middle band line.

Daily timeframe now oil price move below moving average 9 and looking down to reached lower band .price work as support at 80 level price. There are expanding Bollinger band line indicates increasing volatility maybe occurs, While an RSI value of 41 near the SMA line indicates no signal.

H1 timeframe, yesterday oil drops formed rally in a downtrend, now the price move consolidation below moving average 9 and there are expanding band line indicates high volatility occurs. RSi value 30 below the SMA line indicates a downtrend signal trying to enter the oversold zone level.

tIMmtLCs.png

Disclaimer: CFDs are complex instruments and come with a high risk of losing your money.
 
Hello everyone, Monday has come, and the market forex is already open. The market ahead still will become a mystery but still, there is so much hope.

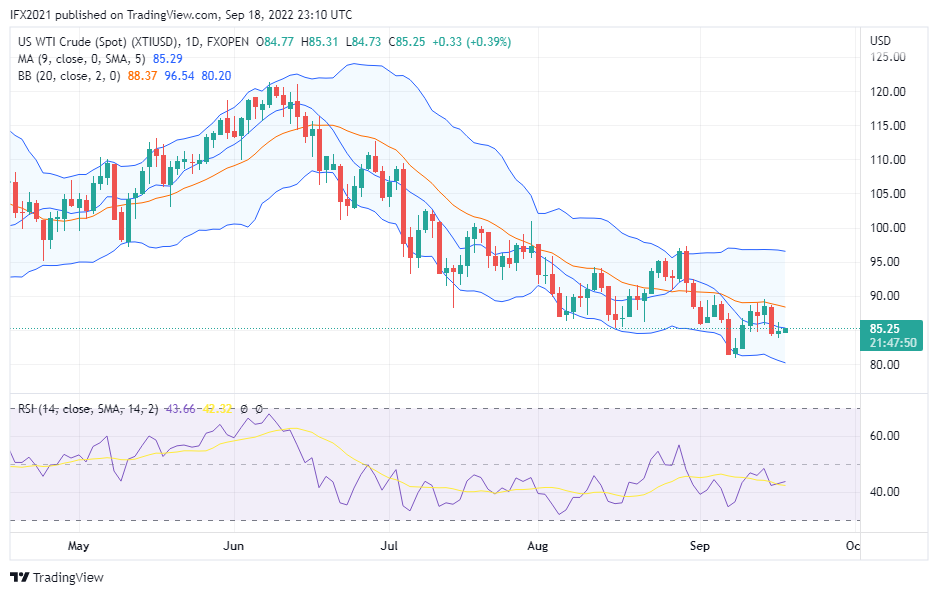
Oil price today still do not differ much from the Friday market, the price still moves trading range after drops too low 84.07, now price is 85.25 based XTIUSD chart FXOpen in Tradingview.

Seems the black gold price is still hard to reach 90 level price. An analyst from Oilprice said if the oil price tends in a bearish market. The reason is fears the economic slowdown in China, the US, and Europe can reduce demands.

XTIUSD Technical analysis

Oil prices now move on moving average 9, the price formed small body candle means low volatility occurs on recent days. In general oil prices still move in a bearish market where the price is below the moving average 9 and the line slope down. First, the resistance-based middle band line is roughly 89 level price and the next support-based lower band is roughly 79.

On the daily timeframe, we can see oil price move below moving average 9 and Bollinger band looks to expand, while RSI value 43 above SMA line indicates buy signal in a bearish market.

H1 timeframe, we get different views the price move on trading range swing high 85 and swing low 84 waiting for a breakout. Bollinger's band looks to narrow indicating low volatility, while an RSI value of 49 above the SMA line indicates a buy signal in a bearish market.

UbnoHbWF.png


Disclaimer: CFDs are complex instruments and come with a high risk of losing your money.
 
Back
Top