fxoday
Recruit
- Messages
- 885
Hello everyone, day by day goes through, the time cycles like a round table. The new day still gives new hope to everyone.
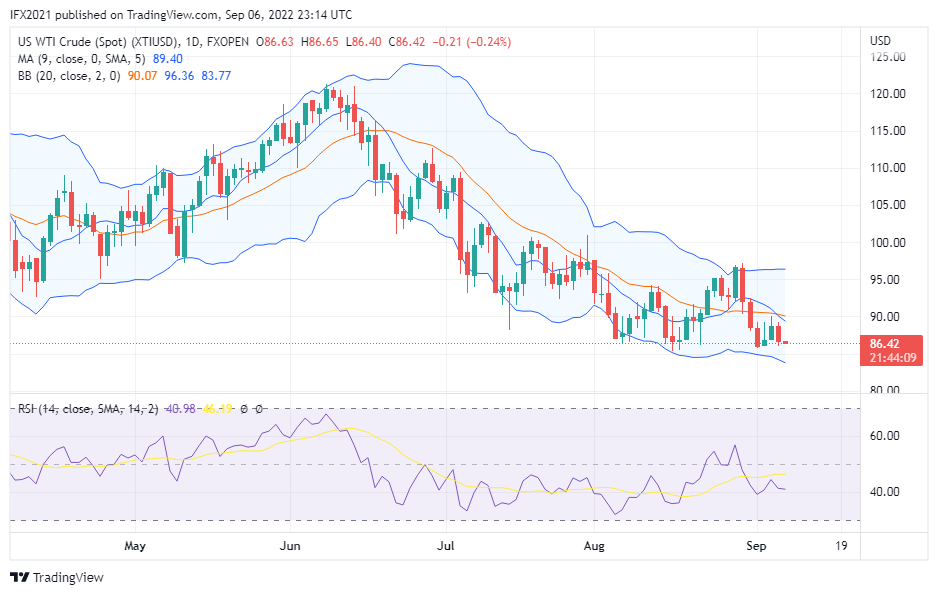
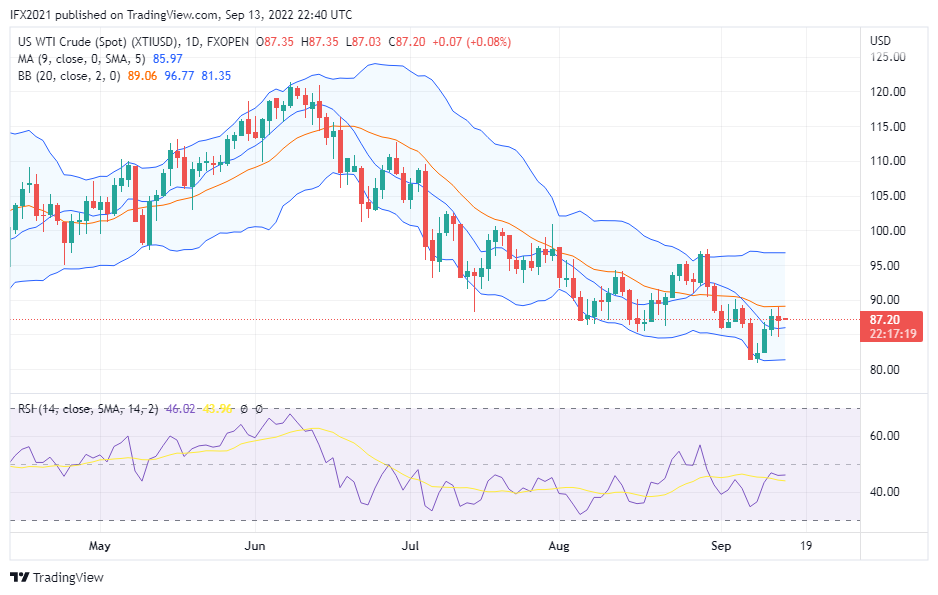
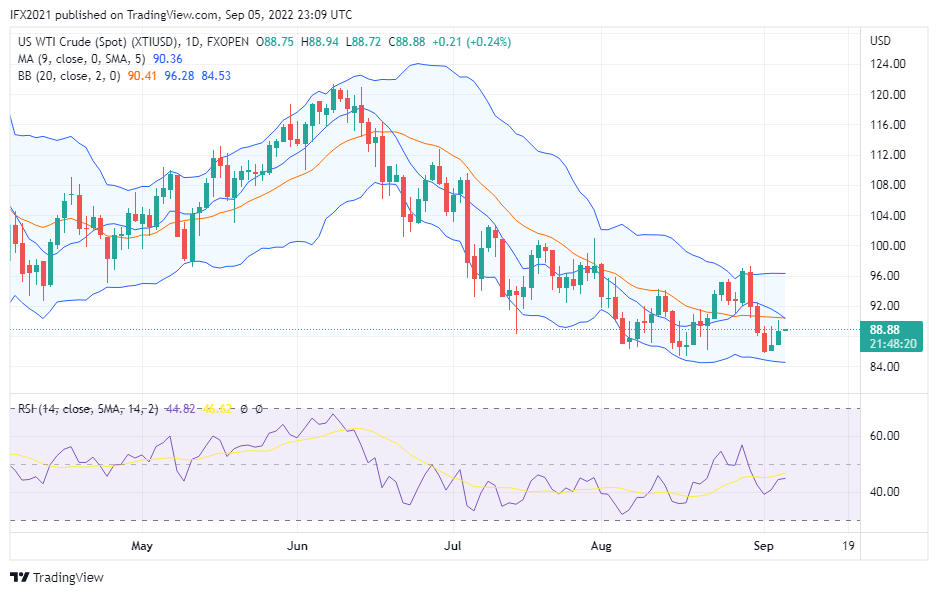
Oil price today move at 88.88 based XTIUSD chart FXOpen in Tradingview. Seems the oil price is still shy of a deep decline, and yesterday shaped a high 90.11 and a low 86.98. Oil price trying to reach the middle band line at 90.40 but there are rejections on its zone.
In today's news, citing to Oilprice, Europe's energy crisis not only hit households but also European Organization for Nuclear Research they will shut down some accelerators and could even idle the LHC to ensure grid stability in the nearby French and Swiss regions amid the severe energy crisis in Europe.
While another news OPEC + decided to cut the collective oil production target by 100,000 barrels per day (BPD) for October, despite Russia reportedly resisting such a move.
XTIUSD Technical analysis
XTIUSD price still moves below moving average 9 and middle band line, the price still moves between middle and lower band line indicates a downtrend.
Daily timeframe, yesterday price trying to rise but hold by resistance on the middle band and get rejection making the price drop to 88. Overall candlestick pattern formed lower high on three candlesticks means there is buying pressure trying to control. RSI value 44 below the SMA line indicates a downtrend.
H1 timeframe, Oil price move below moving average 9 but above middle band line, uptrend weak occurs based indicator. resistance level 89.80 based on upper band and support 87.60. While an RSI value of 53 below the SMA line indicates a downtrend.
Disclaimer: CFDs are complex instruments and come with a high risk of losing your money.