XTIUSD price analysis

Hello everyone, I hope today is always better than the previous day.

Looking at today's market changes, oil prices for US crude are still moving within the daily price range of 76.79 levels

Citing to Oilprice, Crude oil prices moved slightly higher, after the Energy Information Administration reported an inventory increase of 3.5 million barrels for the week to February 16.

XTIUSD technical analysis
a8VrEZTt.png


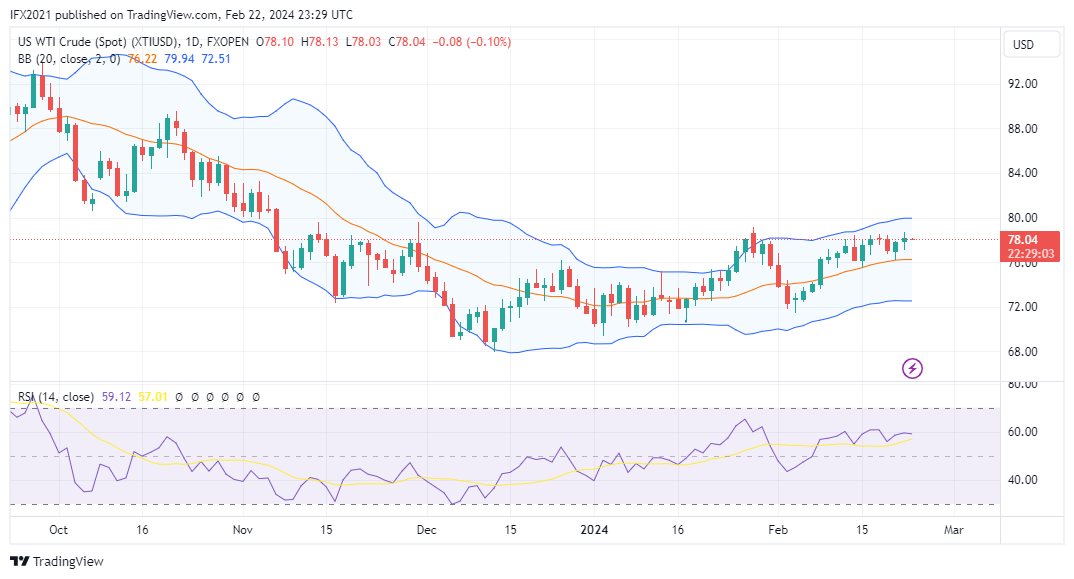
The price of US crude oil formed a Doji candlestick which reflects the Indecision market. The average price still moves between the upper and middle band lines with a swing high at roughly 80 and a swing low at roughly 75.

In the daily time frame, it is clear that the Bollinger bands are forming a slight upward channel with a wide band distance indicating high market volatility.

The MA 50, which takes close data for the past 50 days, forms a slight upward channel below the middle band line, far below the price indicating bullish sentiment.

The RSI indicator, which is an oscillator indicator, shows level 60, which means the price is above the uptrend level.

In the H1 timeframe, oil prices formed a retracement pattern after rising to a high of 78.71 and then falling near the middle band line at roughly 78 level price.

The price seems to be consolidating in this area, if there is a downside breakout the price may find new support near the lower band line.

The MA 50 here forms a flat channel below the price reflecting a sideways market, while the RSI shows level 51 which means the price is in the neutral zone slightly above the uptrend level.

#tradingview #fxopenuk

Disclaimer: CFDs are complex instruments and come with a high risk of losing your money.
 
Hello everyone, have a nice day, I hope this week all traders will make a profit from the trading they do

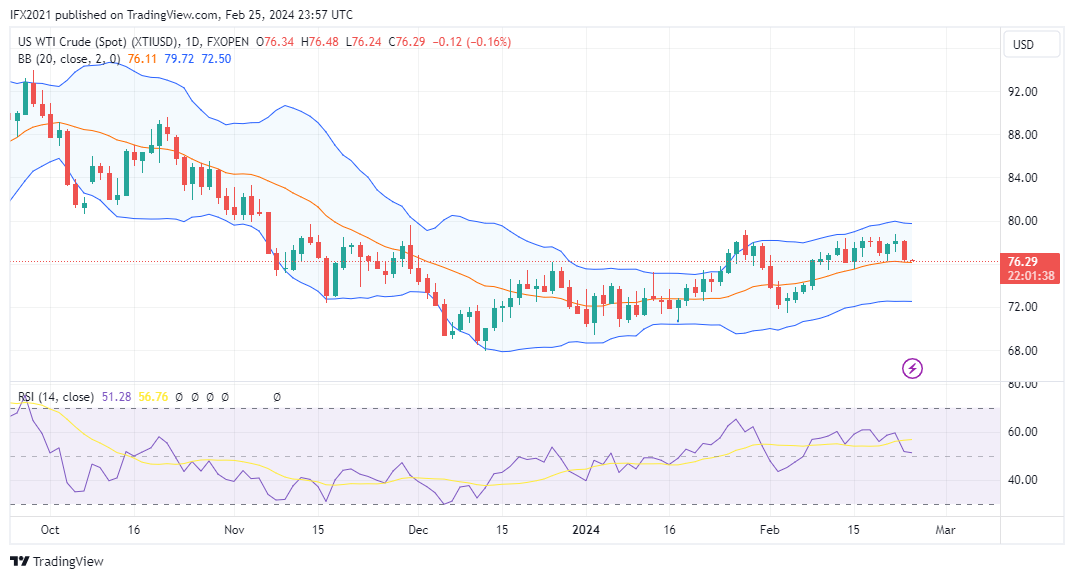
Today's oil price fell 0.14% to 76.29 based on the XTIUSD chart FXOpen in Tradingview. It appears that the price formed a bearish candlestick with a long body today.

Saudi Arabia can no longer raise oil output for cash, according to Oilprice analysts Saudi Arabia scrapped plans to expand oil production capacity as the Public Investment Fund shrank from more than $105 billion in 2022 to around $37 billion in September.

XTIUSD technical analysis

vZCWqJvQ.png


Oil prices are currently moving near the middle band line which may be a support zone in this trading week.

In the daily timeframe, it appears that prices tend to move between the upper and middle band lines.

Here the Bollinger bands form a flat channel with a fairly wide band spacing, indicating that prices tend to be sideways with moderate volatility.

MA 50 is below the middle band line forming a flat channel indicating a sideways market.

The RSI indicator, which is often used to measure overbought and oversold zones, shows level 50, which means the price is in the neutral zone.

In the H1 timeframe, US crude demand prices show a strong market downtrend. The price moved down significantly from a high of 78.71 near the upper band plunging to level 76.13 successfully crossing the middle band and MA 50 from the upper side.

Bollinger bands form a descending channel with a wide band distance indicating high market volatility in a downward trend.

The 50 MA is far above the price forming a descending channel indicating strong bearish momentum. On the other hand, the RSI shows level 32, which means the price is below the downtrend level near the oversold zone.

#tradingview #fxopenuk

Disclaimer: CFDs are complex instruments and come with a high risk of losing your money.
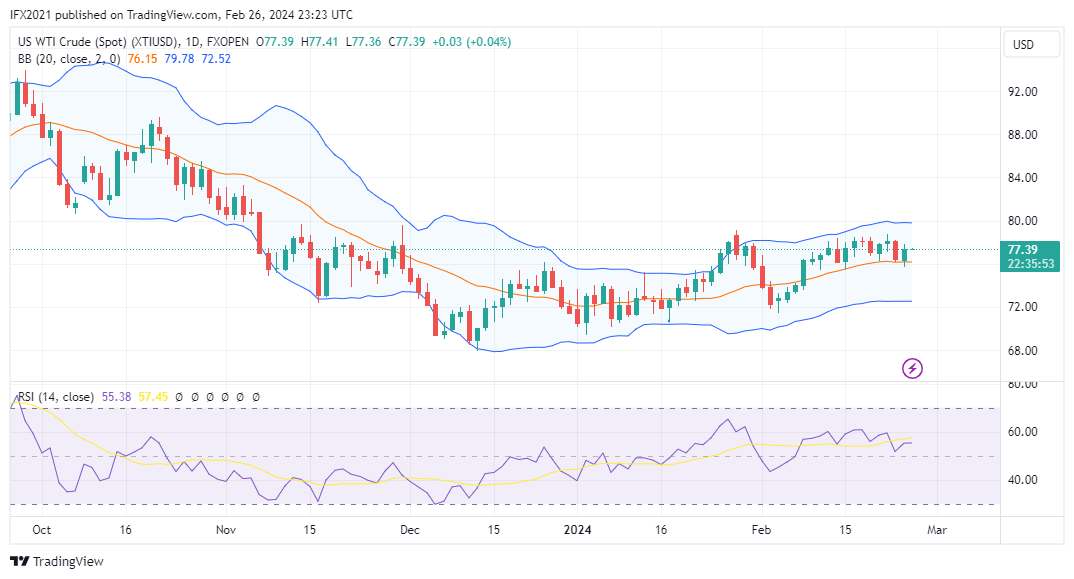
 
Hello everyone, have a nice day, the day will pass but the spirit must remain strong

Today's oil price for US Crude oil rose again to level 77 after previously falling to level 75.70. Price broke the middle band from the upper side but returned to the path above the middle band line.

In the latest news reported by Oilprice, Goldman revised its Forecast of Brent Oil Summer Price to $87 for UK Brent. According to Goldman, the international benchmark Brent Crude will likely remain in the $70-$90 a barrel trading range in the near term amid modest geopolitical premium from the wars in Ukraine and the Middle East.

XTIUSD technical analysis

uw84jiVh.png


US Crude oil prices tend to move in the range between the upper and middle band lines. The Bollinger band line still forms a flat channel with a rather wide band distance, an indication of a sideways market with moderate volatility.

The 50 MA below the price also forms a flat channel, indicating that bullish momentum tends to be sideways.

On the other hand, the RSI indicator shows a value of 55, which means the price is above the uptrend level.

In the H1 timeframe for short-term analysis, the US Crude oil price moves near the upper band line. The price broke the line but finally returned to the band.

Bollinger bands appear to be expanding, indicating high market volatility. The 50 MA below the price forms a descending channel, an indication of a trend transition that occurred after the price broke from the downside.

The RSI indicator shows level 61, which means the price is above the uptrend level.

#tradingview #fxopenuk

Disclaimer: CFDs are complex instruments and come with a high risk of losing your money.
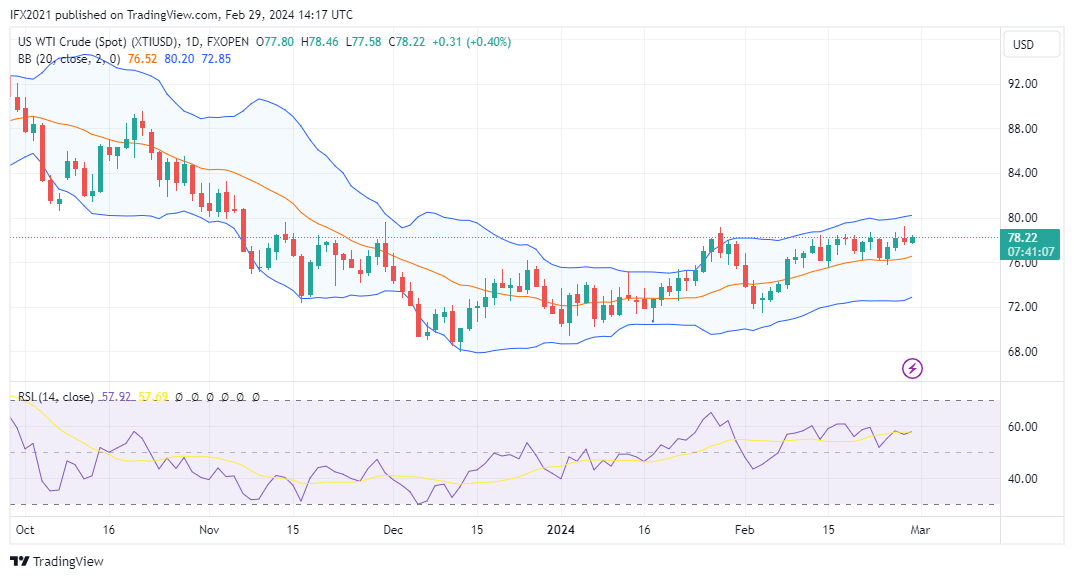
 
Hello everyone, back again with oil market analysis for US Crude Oil

Oil prices tend to still move within the daily range of 76-78 price levels. The current price at 78.22 is up 0.32%.

Although geopolitical events can trigger asset volatility, oil prices are not too affected due to tensions caused by wars in both the Red Sea and Israel, Hamas, and Lebanon.

Expert analysts project that for WTI oil prices surveyed, analysts expect an average price of $76.54 per barrel in 2024. And for the UK Brent Crude prices will average $81.13 a barrel this year.

XTIUSD technical analysis

VOFZCZfi.png


The price of US Crude oil in the daily timeframe shows a candlestick pattern forming a flat channel of ups and downs in the price range 76-80.

The Bollinger band, which measures volatility, appears to be narrowing, indicating decreasing volatility.

MA 50, which is a trend indicator, forms a flat channel near the lower band line, indicating a sideways market with bullish momentum.

The RSI indicator shows level 58, which means the price is above the bull market sentiment level.

H1. In this time frame, the price of US Crude Oil moves randomly up and down in the 77-78 range. You can see the narrowing of the Bollinger band, an indication of less market volatility.

MA 50 near the price forms a flat channel indicating a sideways market.

The RSI indicator shows level 56, which means the price is above bullish sentiment.

Support and resistance. In the short term support zone is near the lower band at roughly 77.50 and resistance is near the upper band line at roughly 79.00
 
Hello everyone, have a nice day, I hope all traders are always healthy and live prosperously.

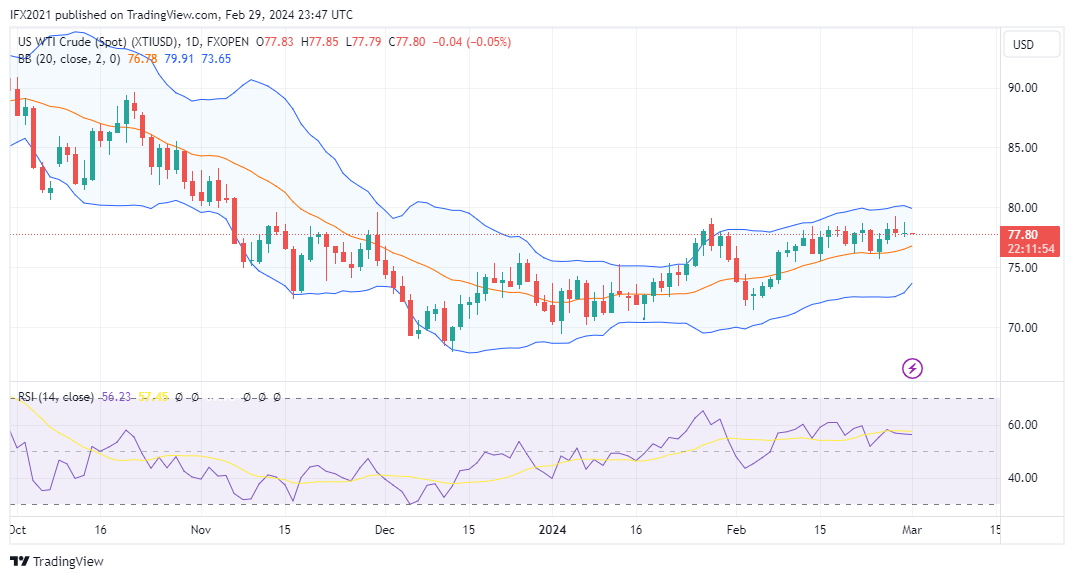
Trading activity continues. Today's US Crude oil price at 77.80 is slightly down 0.04%. Yesterday the price formed a Doji candlestick where the open and close prices were close to each other.

The war in the Middle East seems to be continuing, but US crude oil prices are still in the 76-80 range. There is news that There are new reports saying that Yemen's Houthi group has destroyed several underwater telecommunications cables connecting Europe and Asia, but some reports regarding the extent of the damage are still conflicting.

XTIUSD technical analysis

1PzZ0MKp.png


US crude oil prices fell again after reaching a high of 79.25 down now at 77.80. Prices tend to form doji candlesticks which indicate market indecision.

Bollinger bands appear to be narrowing, indicating decreasing market volatility. This can be seen from the upper and lower bands approaching each other.

MA 50 forms a flat channel near the lower band, indicating a sideways market.

And the RSI indicator shows level 56, which means the price is above the uptrend zone level.

In the short-term H1 timeframe, technical analysis shows the price is near the lower band line which has been the support zone since February 7.

Bollinger bands appear to be forming a flat channel with the band distance forming a support zone near 77.50 and resistance near 78.00.

MA 50 is above the price forming a flat channel indicating a sideways market with the current price below the MA.

The RSI indicator shows a value of 46, an indication that prices are below the downtrend level.

Looking at the recent behavior of oil prices, it is still moving within the swing high range of 79 and swing low of 77. Now the price is at level 77.80. If the price breaks the middle band line from the downside, perhaps the price can reach level 79 again.
 
Hello everyone, Monday is back, new hopes always exist after yesterday's hopes have passed.

Today's US crude oil price has the potential to rise after successfully breaking the upper side of the 79 price level.

Oil-related news reported by Oilprice, anonymous sources at OPEC revealed on Sunday that several OPEC members and allies, spearheaded by Russia, have reached an agreement to extend voluntary oil production cuts from the first quarter to the second quarter of 2024. e next, OPEC's next meeting in June will provide insight into how OPEC views demand growth in developing Asia in late 2024 and 2025.

XTIUSD technical analysis

ZpU8HFzh.png


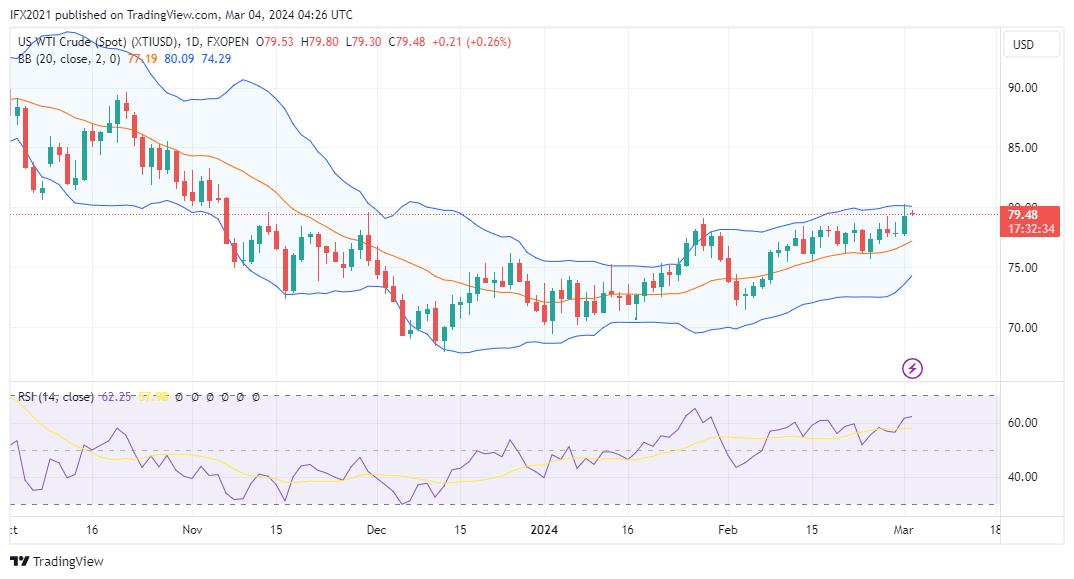
Today's US crude oil price is trading at 78.48 based on XTIUSD chart FXOpen on Tradingview. Oil prices rose slightly by 0.25%.

On the daily timeframe the price is now moving near the upper band line and has succeeded in breaking out to the upside. If volatility increases perhaps oil prices can leave the 79 level and reach 80.

The 50 MA is far below the price and close to the lower band line forming a slight rising channel indicating weak bullish sentiment.

The RSI indicator shows level 63, which means the price is above the uptrend level.

On H1 timeframe, oil prices appear to be correcting near the middle band line after rising to a high of 80.31.

Bollinger bands appear to be narrowing, indicating decreasing market volatility.

MA 50 near the lower band line forms an ascending channel indicating bullish sentiment.

The RSI indicator that measures the overbought and oversold zones shows a value of 57, which means the price is moving above the uptrend level.

Support and Resistance

The US crude oil support zone is estimated to be near the lower band line at roughly 75 and resistance is estimated to be near the upper band line at roughly 80.

Final thoughts

Oil prices seem to tend to form a bullish pattern, if there is a breakout of level 80, perhaps oil prices will get a boost. However, if there is a downside breakout, oil prices may fall near the middle band which is the first support.
 
Hello everyone, have a nice day, hope all traders make green pips today.

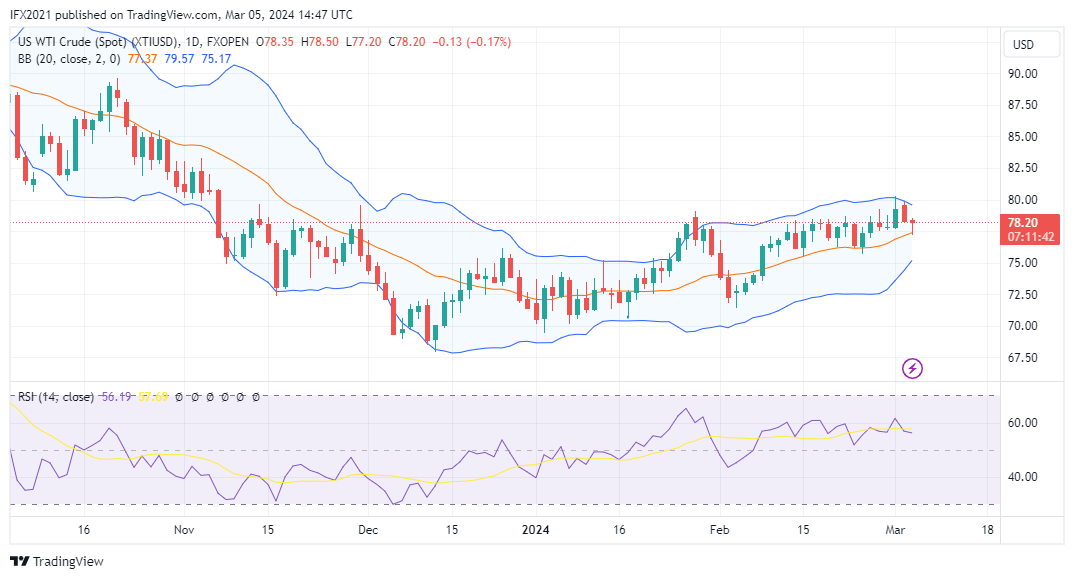
US Crude oil prices fell again to a low of 77.20 after previously reaching 80.31. Now US Crude price is trading at 70.20 and trying to bounce up after hitting the middle band line.

Commodities analyst Helima Croft of RBC told Bloomberg in an interview that oil prices are expected to be much higher if the conflict in the Middle East escalates.

The commodities analyst noted the resilience of oil demand in China as another important factor for prices, saying that although China's macroeconomic picture may show weak demand.

XTIUSD technical analysis

rFp7u2BT.png


Even though it has fallen, oil prices are still hovering in the market range of 75-80.

US Crude oil price is now moving between the upper and middle band lines. In the daily timeframe, it is witnessed that the Bollinger band is narrowing, indicating that market volatility is decreasing.

The 50 MA is forming an ascending channel near the lower band line, an indication of bullish sentiment, although it is slow to move.

The RSI indicator that measures volatility formed a downward channel at level 53, which means the price is still above the uptrend level.

In the H1 timeframe, it appears that US Crude prices are trying to rise again after falling below the lower band line. Here the Bollinger bands appear to be narrowing, indicating decreasing volatility.

MA 50 is above the upper band line forming a flat channel indicating a sideways market with prices below the trend line.

The RSI indicator shows a value of 46, which means the price is below the downtrend level.

Support and resistance

Based on the Bollinger band line, the price resistance level is near the upper band line area at roughly 80 and the support zone-based lower band at roughly 75.
 
Hello everyone, have a nice day, I hope all traders in the FPA community are healthy and happy as always.

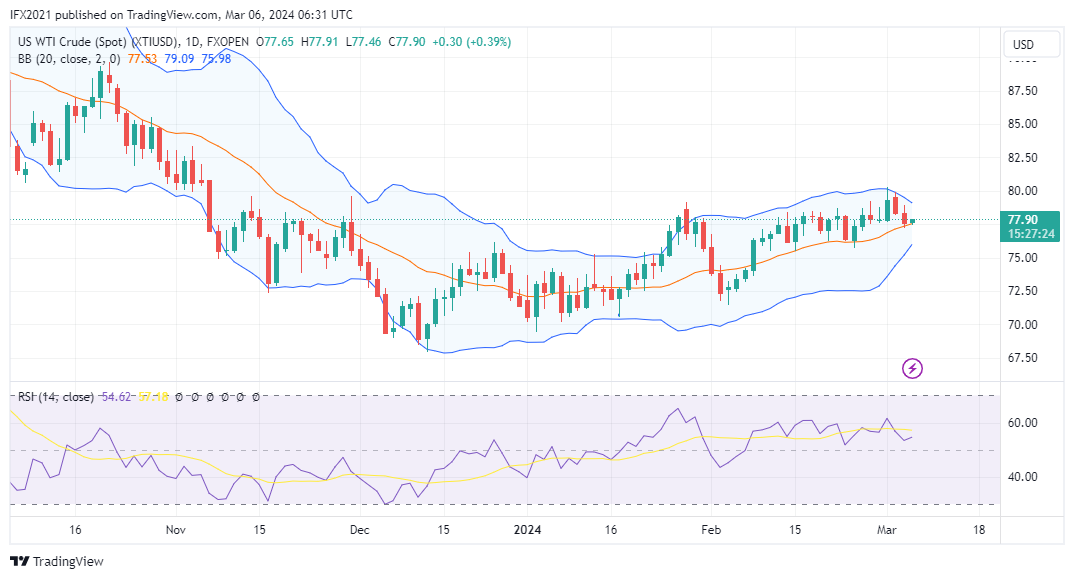
Monitoring today's oil prices for US crude oil is at the price level of 77.90 based on the XTIUSD chart FXOpen on Tradingview. Oil prices move near the middle band line.

Analysts from Oilprice stated that oil prices were steady because crude oil inventories in the United States rose this week, by 423,000 barrels for the week ending March 1. The American Petroleum Institute (API) reported an increase in crude oil inventories of 8.428 million barrels in the previous week.

The Department of Energy (DoE) reported that crude oil inventories in the Strategic Petroleum Reserve (SPR) rose by 0.7 million barrels on March 1. Inventories now stand at 361 million barrels—the highest level since May 2023. Oil prices fell ahead of the API data release despite news from OPEC+ that the group had agreed to extend voluntary production cuts into the next quarter.

XTIUSD Technical analysis

5peRwVYY.png


US crude oil prices are steady at around 77.90 after yesterday's decline. The price is now moving near the middle band line which is the price consolidation zone.

Bollinger bands appear to be converging, indicating decreasing market volatility. On the other hand, the MA 50, which takes the average close price for the past 50 days, forms a slight upward channel below the lower band line.

The RSI indicator used to measure the overbought and oversold zone shows level 54, which means the price is above the uptrend level.

In the H1 timeframe, the price of US crude oil appears to be moving near the middle band line which is the consolidation zone. Here the Bollinger bands form a downward channel with a wide band distance indicating a downtrend with quite high volatility.

MA 50 forms a descending channel with an upper band line indicating a downtrend market. And the RSI indicator shows a value of 49, which means the price is in the neutral zone.

Final thoughts

Oil prices still tend to be stable, moving within the daily price range of 75-80 levels. Even though it was influenced by the extension of production cuts by OPEC+, it seems that the market has not responded much.
 
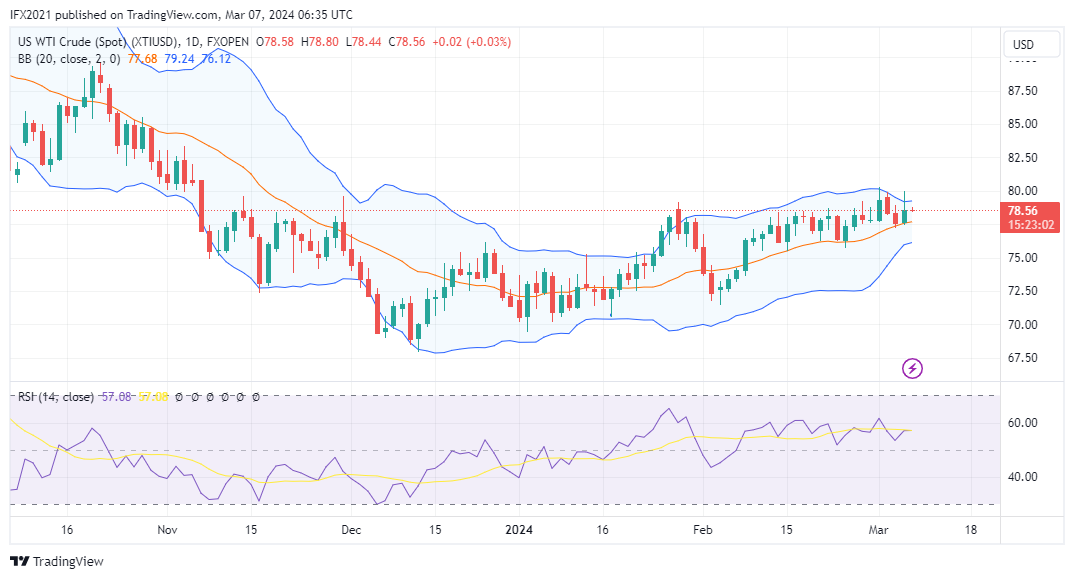
Hello everyone, have a nice day, always be grateful for all the good fortune you get, don't forget to give alms.

Today, monitoring the CFD market for US Crude oil or XTIUSD now shows the price at 78.56. Yesterday oil prices rose again to a high of 79.99 after falling to a low of 77.46.

Oil-related news reported by Oilprice, Finance Minister Jeremy Hunt said that the UK was extending the windfall tax on oil and gas operators in the UK North Sea for one year until March 2029. This was a move expected by analysts and opposed by the industry.

The initial windfall tax, officially known as the Energy Profits Levy, was implemented in May 2022, when Rishi Sunak's government announced a temporary 25% tax intended to represent the extraordinary profits as oil and gas prices soared. In November 2022, the levy was increased by 10 percentage points to 35% from January 1, 2023 to March 2028.

XTIUSD technical analysis

xY9FUTOa.png


In general, oil prices are currently still stable within the price range of 75-80 for WTI oil.

The price is now moving between the upper and middle band lines with a low at 77 and a high of 79 price levels.

Bollinger bands are narrowing indicating less volatility over oil.

MA 50 near the lower band line forms a slight rising channel indicating an uptrend.

The RSI indicator, which is a leading indicator, shows a value of 56, which means the price is above the uptrend zone level.

In the H1 timeframe, oil prices move near the middle band line which is a consolidation zone.

Bollinger bands draw into flat and narrow slightly, indicating reduced market volatility.

MA 50 forms a flat channel below the Sideways market indication price with resistance near the upper band at roughly 80 and support near the lower band at roughly 78.

The RSI indicator shows a value of 53, which means the price is above the uptrend level.

Support and resistance

Typically oil prices move within the range of 75 as the support zone and 80 as the resistance zone. Even though in the long term the 50 MA indicates bullish sentiment, it is still at a weak level.

Final thoughts

US crude oil prices may still fluctuate within the daily price range. However, analysts still believe that the escalation of war in the Middle East has the potential to trigger an increase in oil prices.
 
Hello everyone, have a nice day, The Friday market in the last week's forex market opened.

Seeing that today's US crude oil price is still moving stagnant between the upper and middle band lines in the price range of 77-80.

The market structure has not changed much, perhaps traders are not betting much on oil even amidst the geopolitical tensions in the Middle East.

The latest news citing Oilprice, Central banks globally are likely accumulating gold as a strategy to diversify away from the dollar, in light of concerns over persistent US fiscal deficits and inflationary pressures.

XTIUSD technical analysis

HDv9KLvg.png


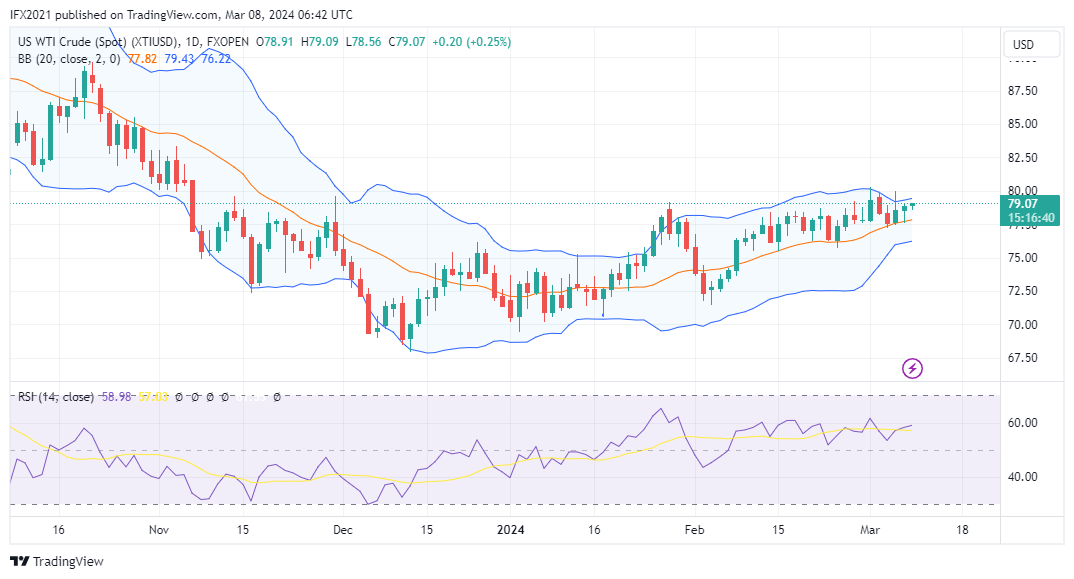
US Crude oil price is trading at 79.07 at the time of writing. The price is below the upper band, slightly above the middle band line.

Seeing that the Bollinger band structure now forms a flat, narrowing channel, this reflects low market volatility.

MA 50 is still forming a slight upward channel near the lower band line, an indication that in a sideways market prices tend to have a slow uptrend.

The RSI indicator shows a value of 60, which means the price is above the uptrend level.

On the H1 timeframe, oil prices move below the upper band line. Here the Bollinger band line expands slightly, reflecting a slight increase in volatility.

The MA 50 line is near the middle band drawing a flat line reflecting a sideways market. On the other hand, the RSI shows level 61, which means the price is above the uptrend level.

Support and Resistance

In the short term based on the H1 timeframe, the resistance level refers to the upper band line at roughly 79.25, and the support zone is based on the lower band line at roughly 77.77. Bollinger band line can be dynamic resistance and support.
 
Back
Top