fxoday
Recruit
- Messages
- 884
Hello everyone, Happy Monday, I hope this week all traders get the best profits.
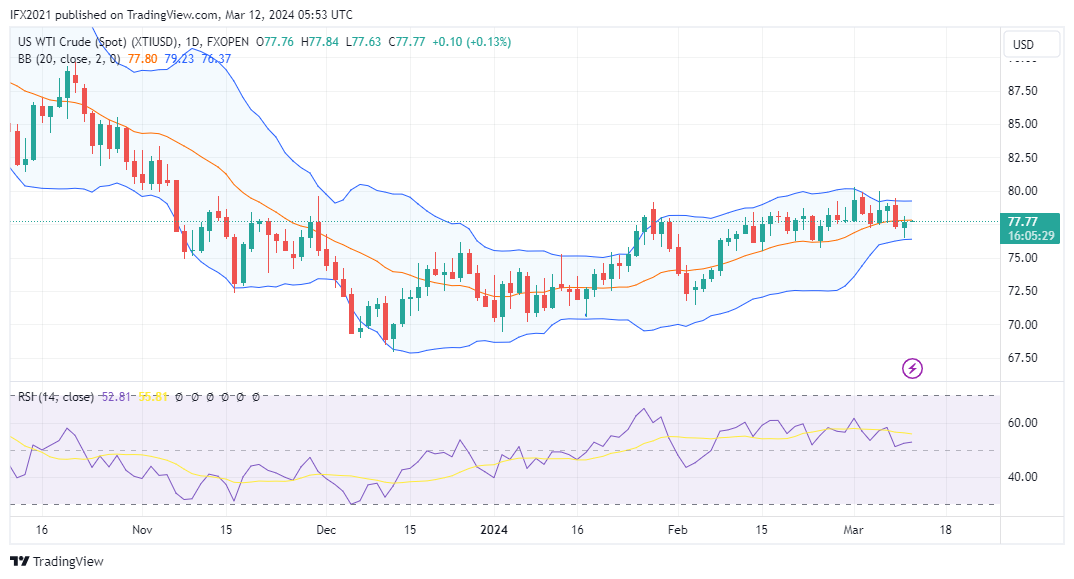
US Crude oil prices were observed to fall again to a low of 77.05. This decline indicates that oil demand tends to be stable even though geopolitical tensions in the Middle East are increasingly tense.
Reporting from Oilpice, China is still holding the key to 2024 global oil demand. Chinese imports rose in January and February this year compared to the same two months of last year.
Despite an increase in China's crude oil imports in the first two months of 2024, it's too early to say how the purchases of the world's top crude importer will impact global oil demand and prices this year.
XTIUSD Technical analysis
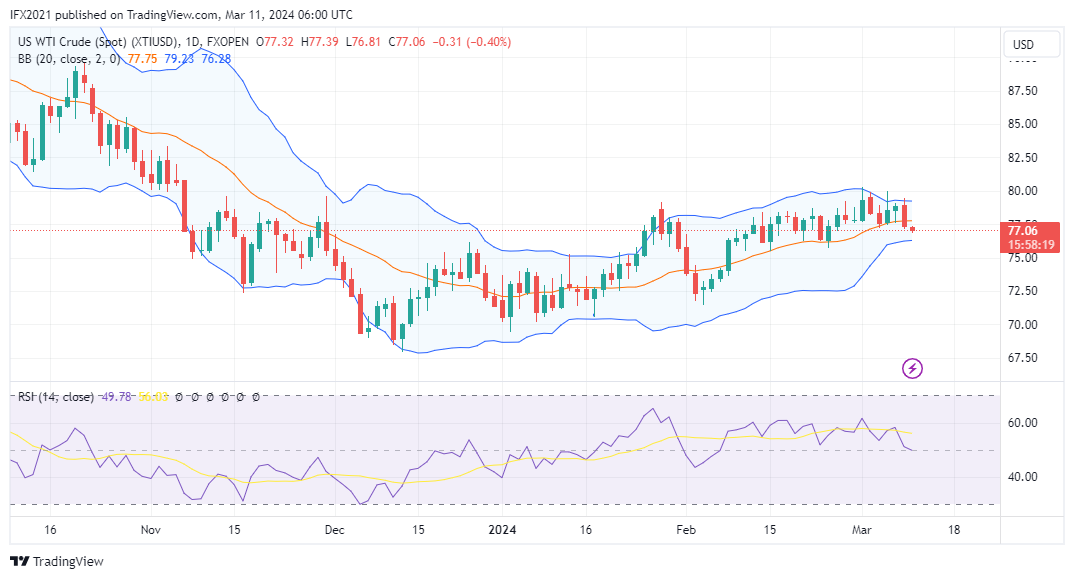
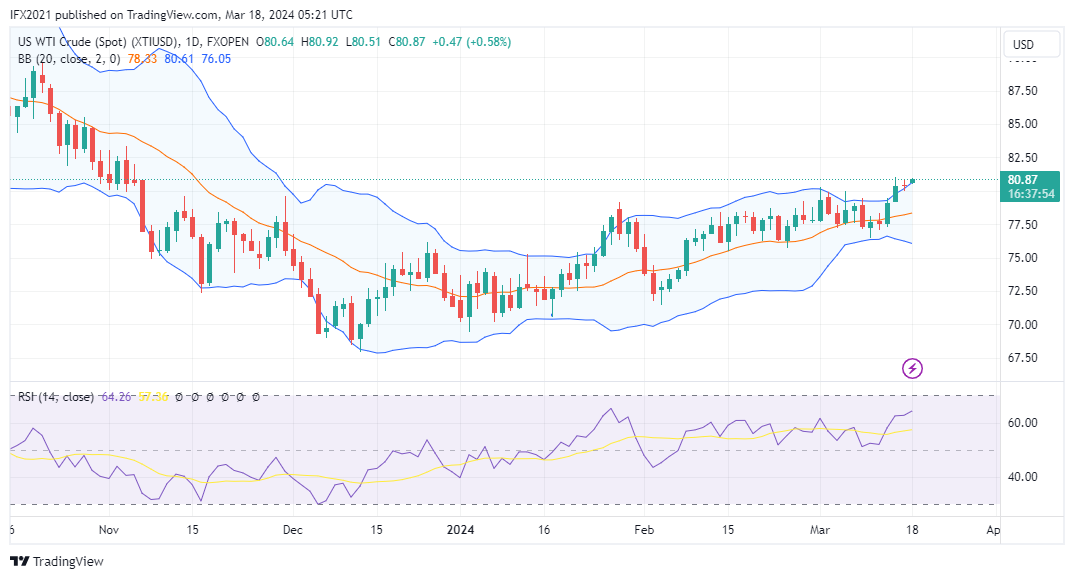
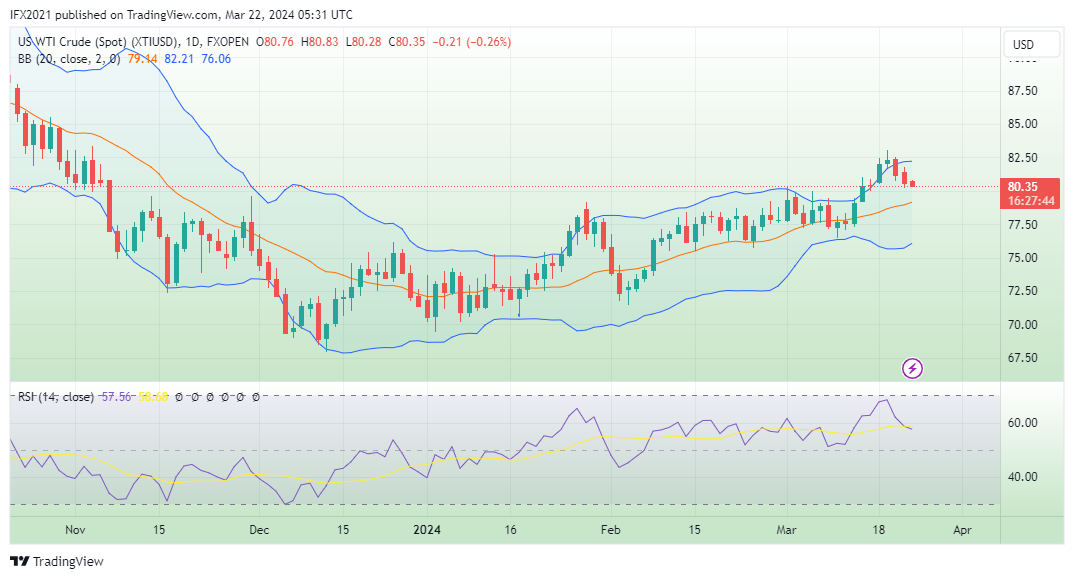
US Crude oil prices are now moving below the middle band line. The price has crossed the line from the upper side trying to go towards the lower band line which is dynamic support at roughly 76.74. In general, oil prices are in the 75-80 price level range.
MA 50 which forms an ascending channel is near the lower band line could be the next dynamic support at roughly 76.16.
The Bollinger band line appears to be narrowing in this time frame, indicating a decrease in market volatility. On the other hand, the RSI indicator shows level 47, which means the price is below the downtrend level.
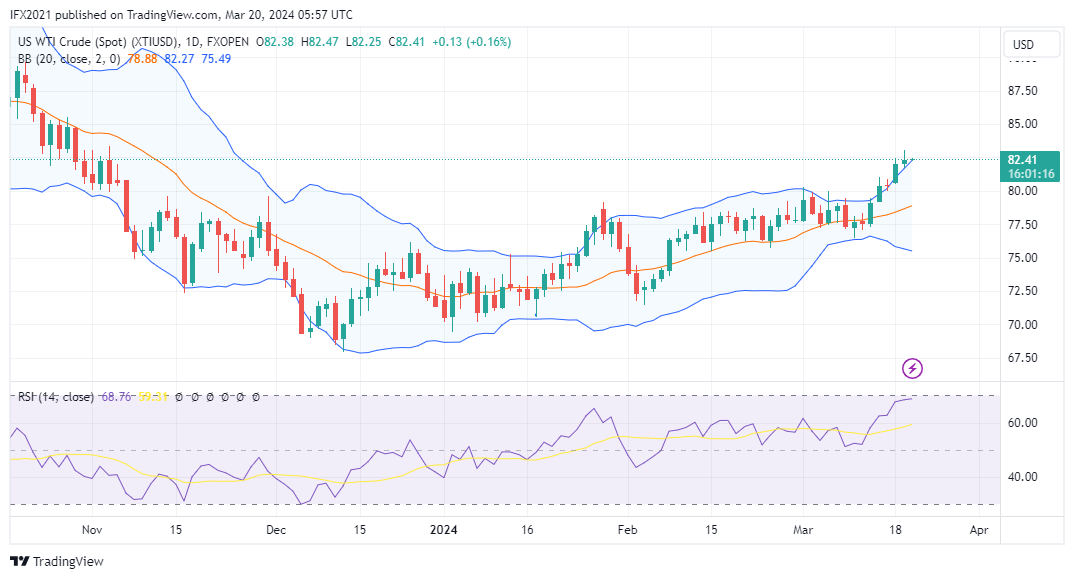
In the H1 timeframe, the US Crude Oil price tried to bounce after falling to a low of 76.81. The price is still moving below the middle band line. In this time frame, the Bollinger bands form a descending channel with the band distance starting to narrow, indicating that volatility may decrease.
The RSI indicator that measures the overbought and oversold zone shows level 38, which means the price is below the downtrend level.
Support and resistance
The resistance zone is based on the upper band line of US Crude Oil at roughly 80.00 and the support zone is based lower band line at roughly 76.16.
Even though oil prices have fallen today, they are still in the 75-80 price range. It seems that the good news from China has not been able to cause a significant increase in oil prices
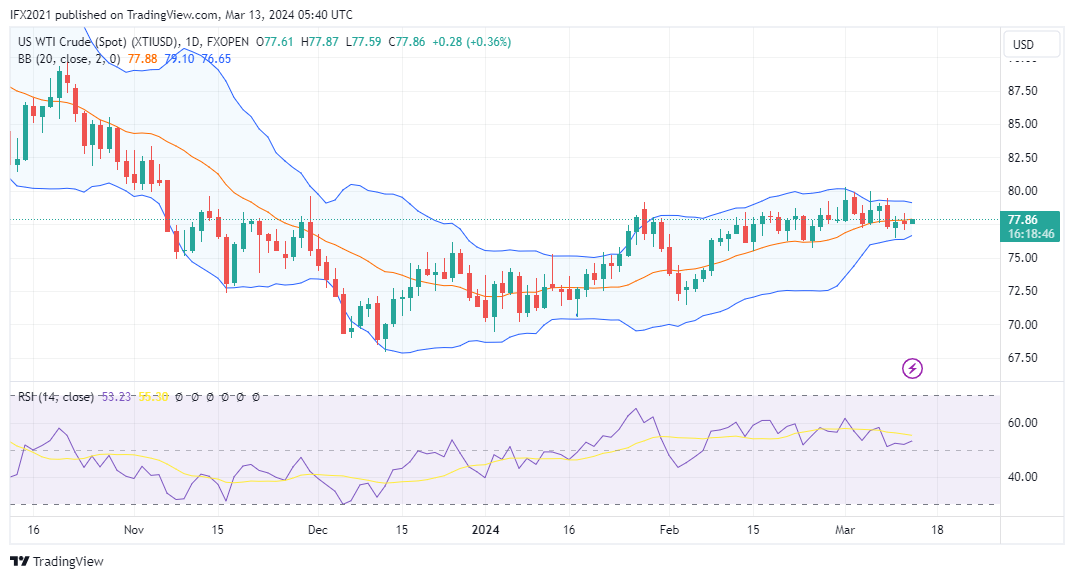
US Crude oil prices were observed to fall again to a low of 77.05. This decline indicates that oil demand tends to be stable even though geopolitical tensions in the Middle East are increasingly tense.
Reporting from Oilpice, China is still holding the key to 2024 global oil demand. Chinese imports rose in January and February this year compared to the same two months of last year.
Despite an increase in China's crude oil imports in the first two months of 2024, it's too early to say how the purchases of the world's top crude importer will impact global oil demand and prices this year.
XTIUSD Technical analysis
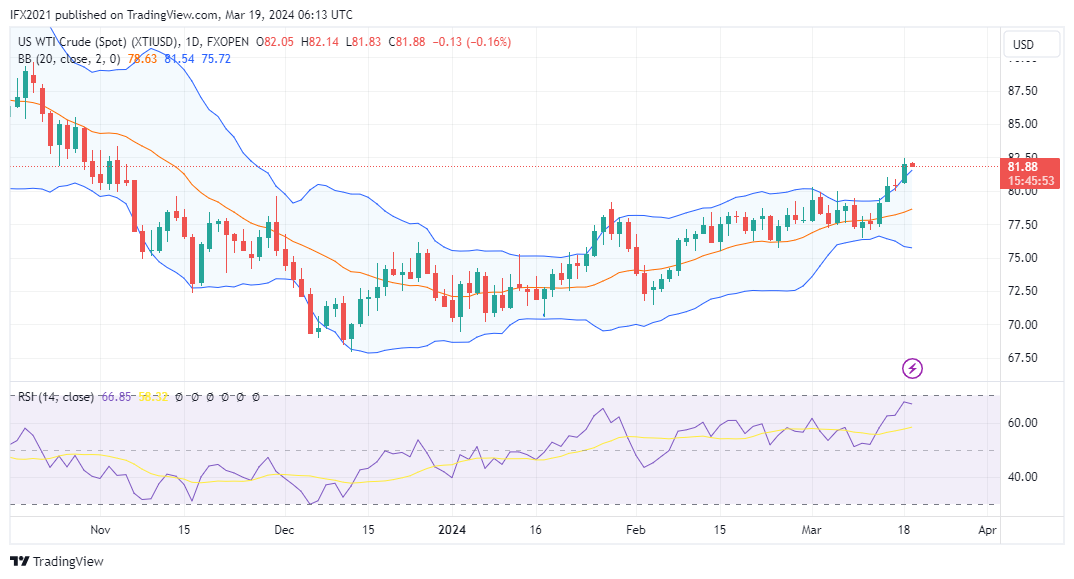
US Crude oil prices are now moving below the middle band line. The price has crossed the line from the upper side trying to go towards the lower band line which is dynamic support at roughly 76.74. In general, oil prices are in the 75-80 price level range.
MA 50 which forms an ascending channel is near the lower band line could be the next dynamic support at roughly 76.16.
The Bollinger band line appears to be narrowing in this time frame, indicating a decrease in market volatility. On the other hand, the RSI indicator shows level 47, which means the price is below the downtrend level.
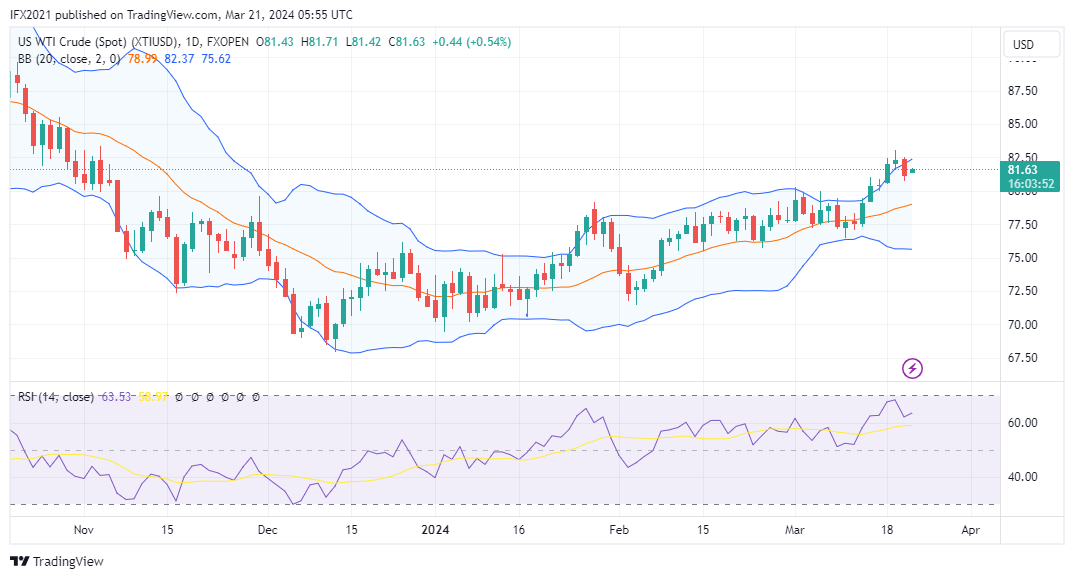
In the H1 timeframe, the US Crude Oil price tried to bounce after falling to a low of 76.81. The price is still moving below the middle band line. In this time frame, the Bollinger bands form a descending channel with the band distance starting to narrow, indicating that volatility may decrease.
The RSI indicator that measures the overbought and oversold zone shows level 38, which means the price is below the downtrend level.
Support and resistance
The resistance zone is based on the upper band line of US Crude Oil at roughly 80.00 and the support zone is based lower band line at roughly 76.16.
Even though oil prices have fallen today, they are still in the 75-80 price range. It seems that the good news from China has not been able to cause a significant increase in oil prices