fxoday
Recruit
- Messages
- 884
Hello everyone, have a nice day, I hope everyone is in good health
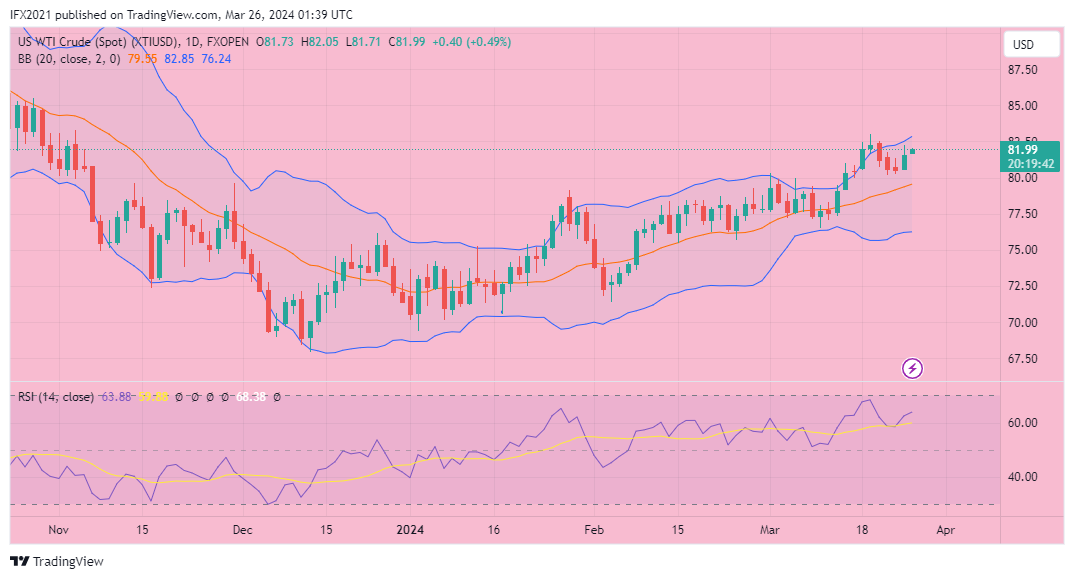
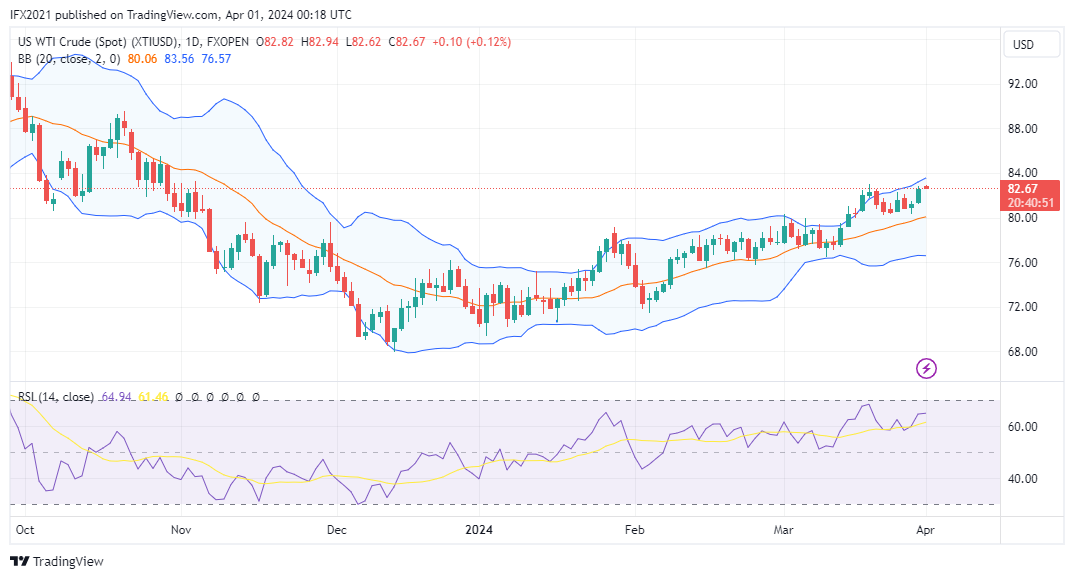
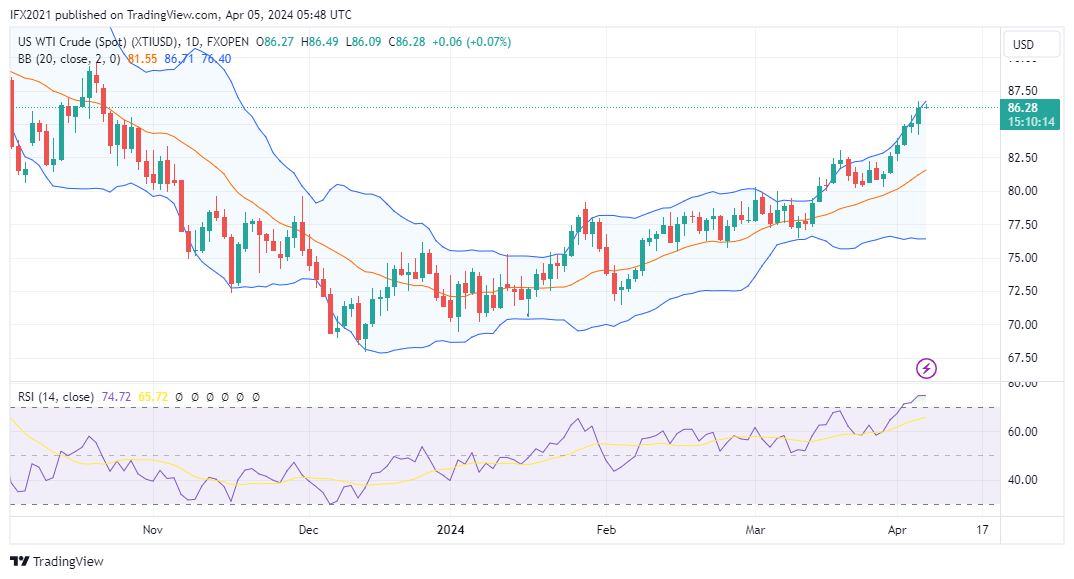
Today's US crude oil price is trading at 80.99, slightly up 0.58% and forming a small bull candle.
Ukrainian drone attack on Russian oil refinery gets reaction from US. The United States urged Ukraine to halt drone attacks on Russian oil refineries due to Washington's assessment that such attacks could lead to Russian retaliation and push up global oil prices. Reporting from Oilprice, the Ukrainian drone attack knocked out 600,000 bpd of Russia's refining capacity.
XTIUSD technical analysis today
US Crude oil prices have reached the 2024 high of 83.03 but fell again to a low of 80.21. In general, prices were still moving above the psychological level of 80 during last week's trading.
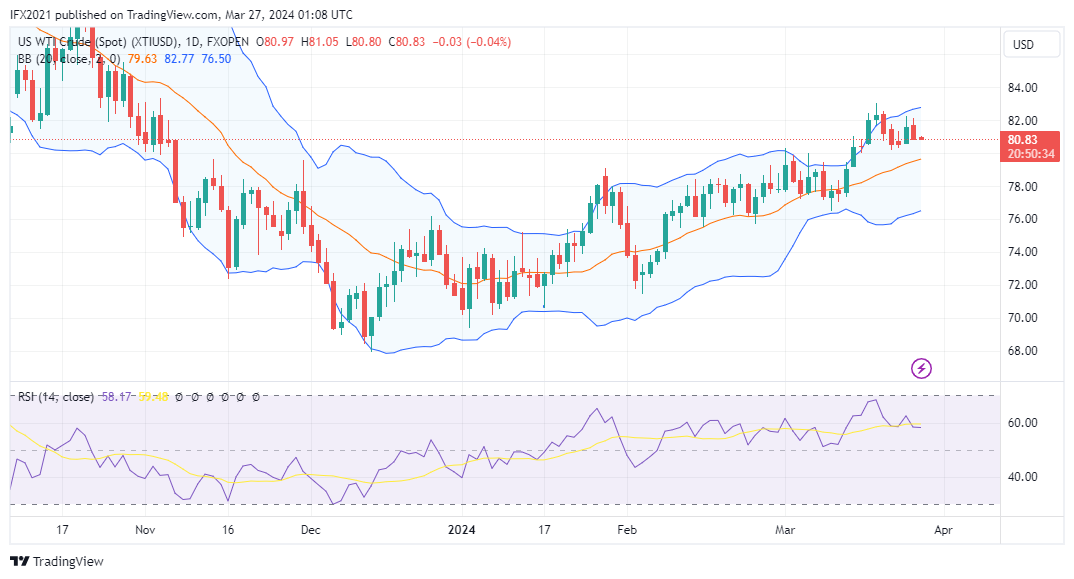
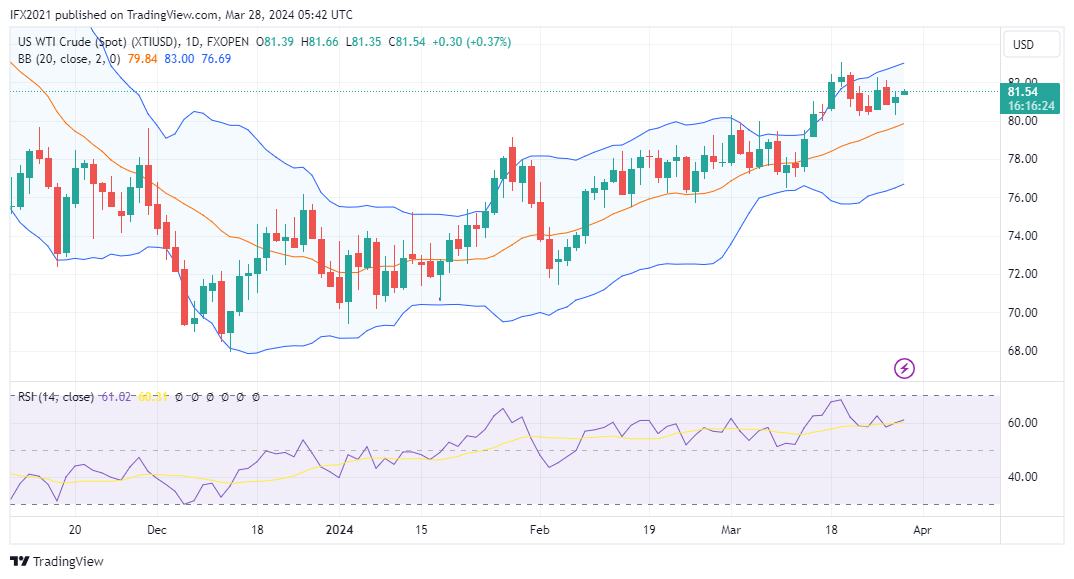
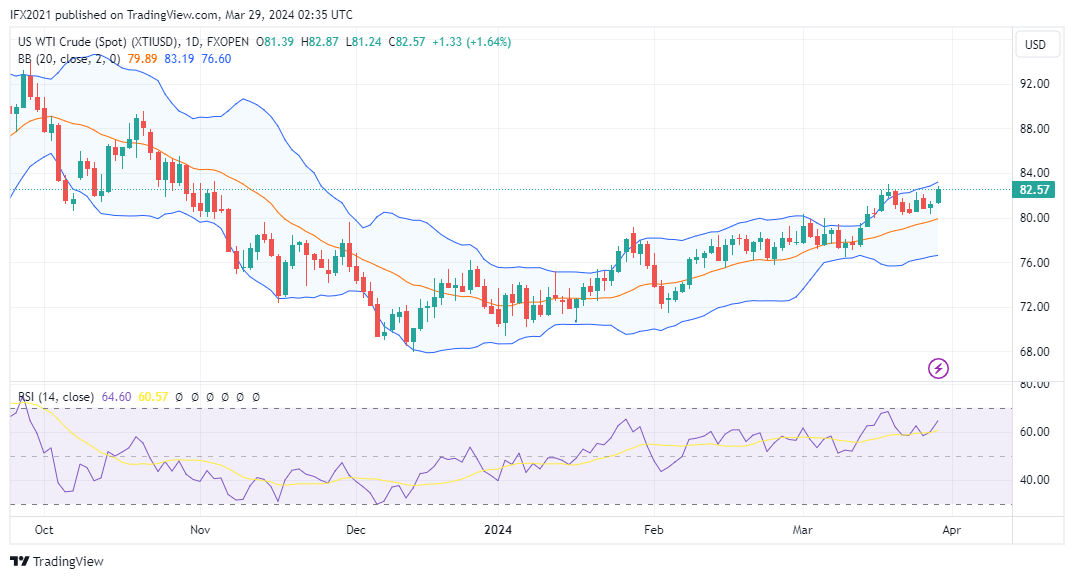
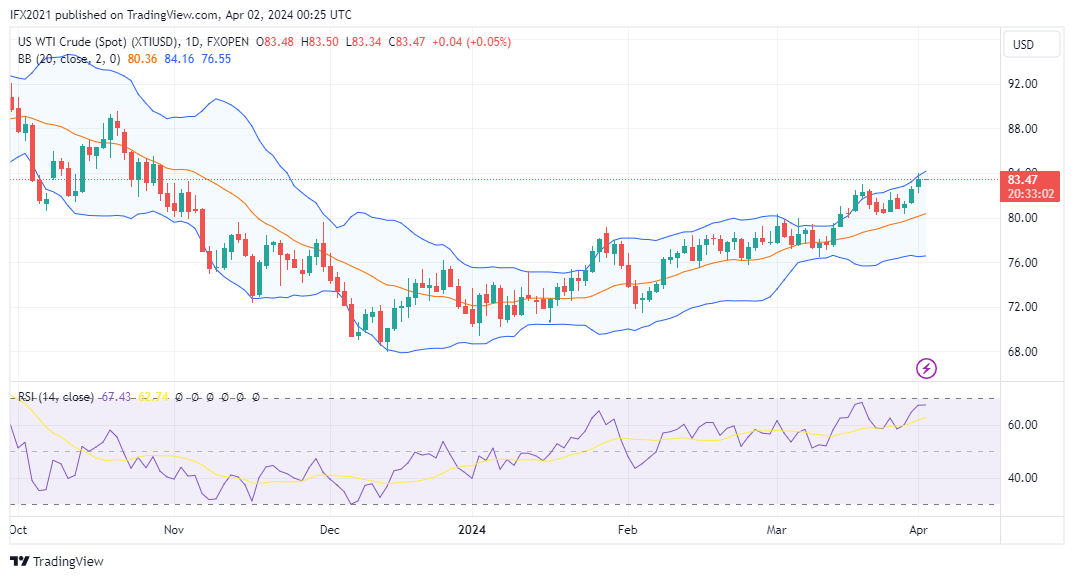
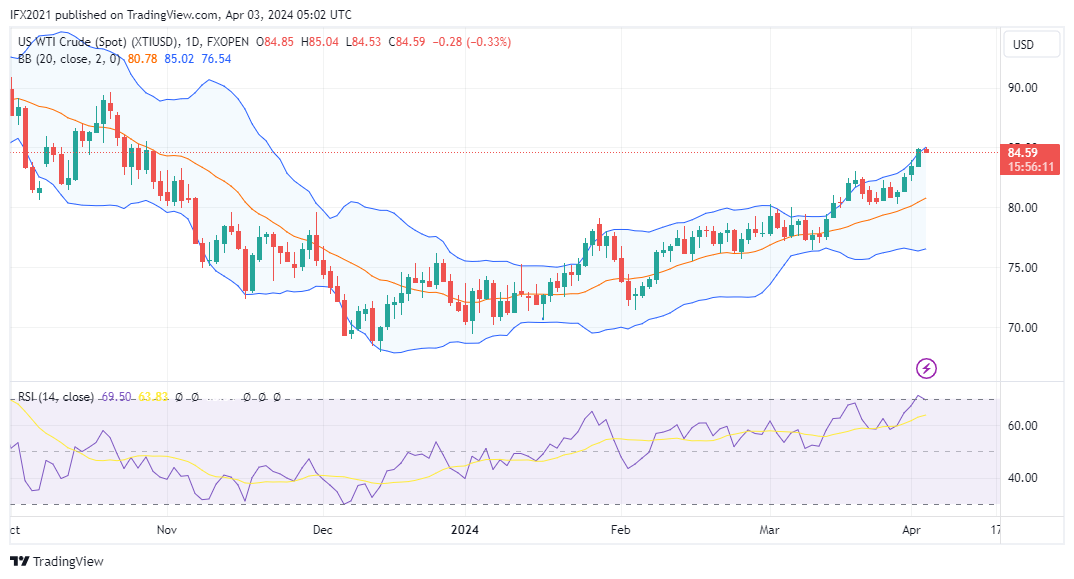
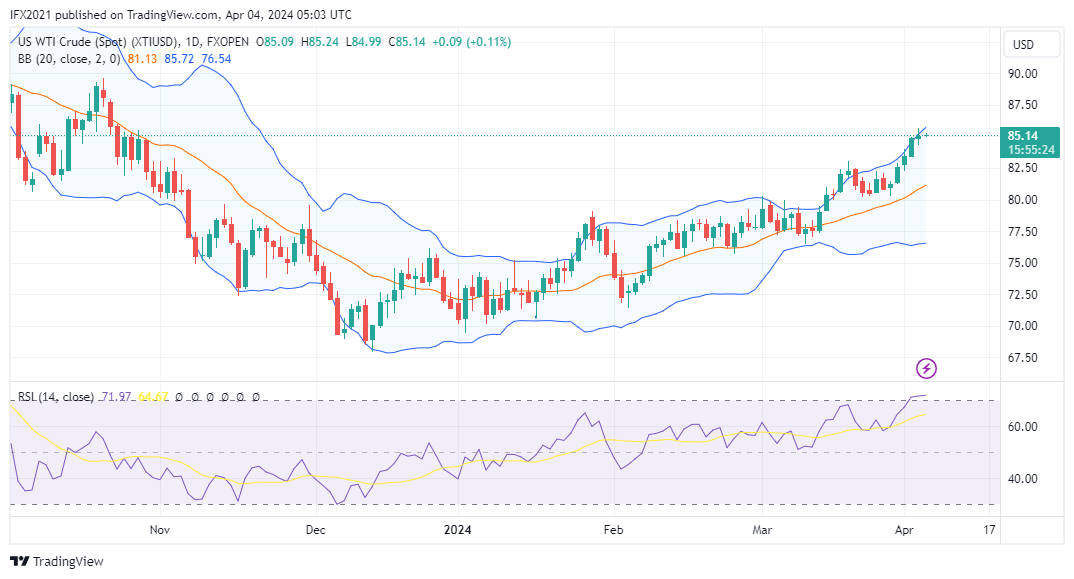
On the daily timeframe, US crude oil prices move above the middle band line. Bollinger bands are still forming a slight upward channel with wide band spacing, an indication of high market volatility.
MA 50 is below the middle band line forming an upward channel indicating bullish sentiment on strong momentum.
The RSI indicator shows a value of 61, which means the price is moving above the uptrend level.
On H1 timeframe, US crude oil prices move between the upper and middle band lines. Bollinger bands in this time frame form a flat channel with slightly narrowed bands, indicating a sideways market with slightly reduced volatility.
MA 50 is near the middle band line forming a flat channel indicating a sideways market with prices above the line.
The RSI indicator shows level 56, which means the price is moving above the uptrend level.
Support and resistance
In the hourly period, the US crude oil support zone is estimated to be near the lower band line at roughly 80.35 and the resistance zone is near the upper band line at roughly 81.20.
In the daily period, the support zone for US crude oil is estimated to be near the lower band at roughly 76.50 and resistance near the upper band at roughly 83.00.
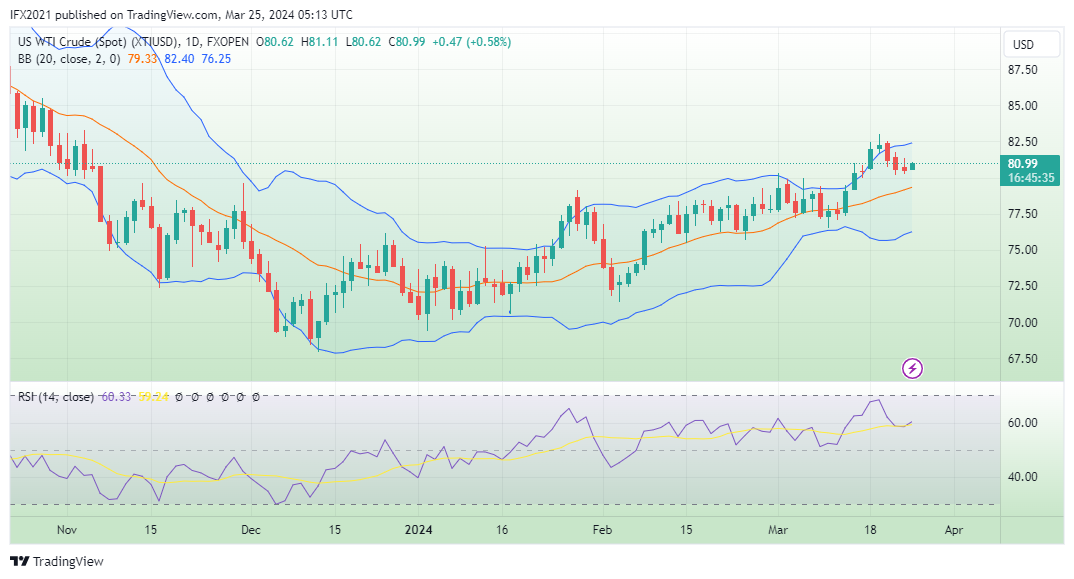
Today's US crude oil price is trading at 80.99, slightly up 0.58% and forming a small bull candle.
Ukrainian drone attack on Russian oil refinery gets reaction from US. The United States urged Ukraine to halt drone attacks on Russian oil refineries due to Washington's assessment that such attacks could lead to Russian retaliation and push up global oil prices. Reporting from Oilprice, the Ukrainian drone attack knocked out 600,000 bpd of Russia's refining capacity.
XTIUSD technical analysis today
US Crude oil prices have reached the 2024 high of 83.03 but fell again to a low of 80.21. In general, prices were still moving above the psychological level of 80 during last week's trading.
On the daily timeframe, US crude oil prices move above the middle band line. Bollinger bands are still forming a slight upward channel with wide band spacing, an indication of high market volatility.
MA 50 is below the middle band line forming an upward channel indicating bullish sentiment on strong momentum.
The RSI indicator shows a value of 61, which means the price is moving above the uptrend level.
On H1 timeframe, US crude oil prices move between the upper and middle band lines. Bollinger bands in this time frame form a flat channel with slightly narrowed bands, indicating a sideways market with slightly reduced volatility.
MA 50 is near the middle band line forming a flat channel indicating a sideways market with prices above the line.
The RSI indicator shows level 56, which means the price is moving above the uptrend level.
Support and resistance
In the hourly period, the US crude oil support zone is estimated to be near the lower band line at roughly 80.35 and the resistance zone is near the upper band line at roughly 81.20.
In the daily period, the support zone for US crude oil is estimated to be near the lower band at roughly 76.50 and resistance near the upper band at roughly 83.00.