XTIUSD price analysis

Hello everyone, have a nice day, hope today all traders members FPA forum will be profitable.

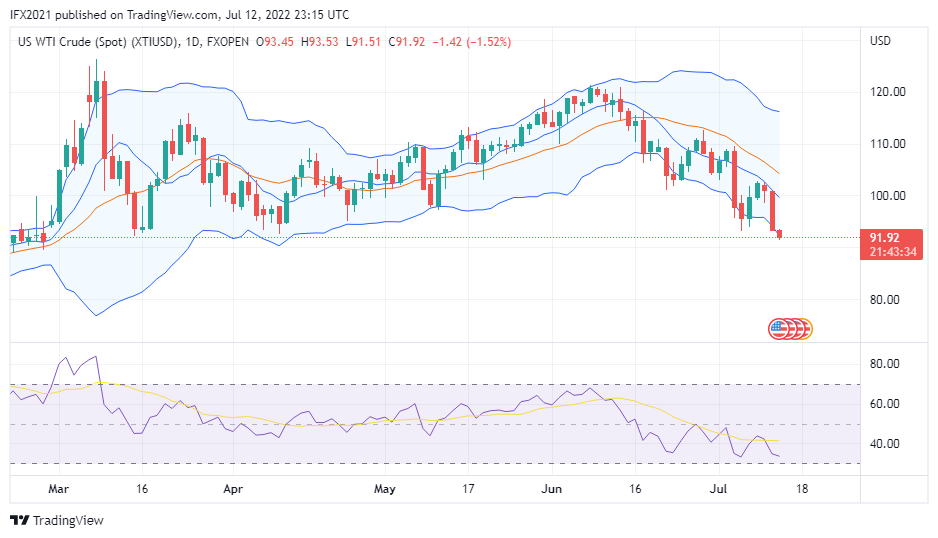
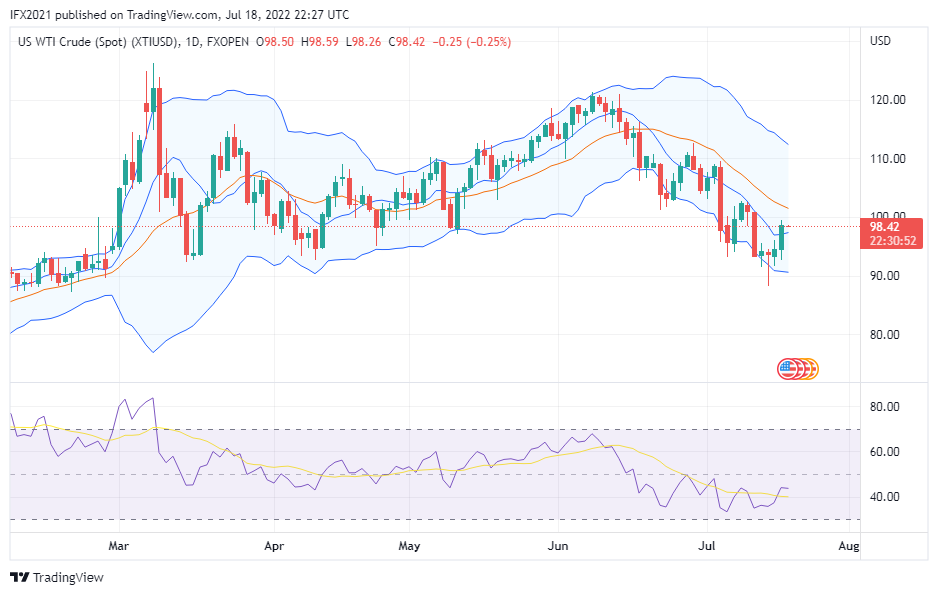
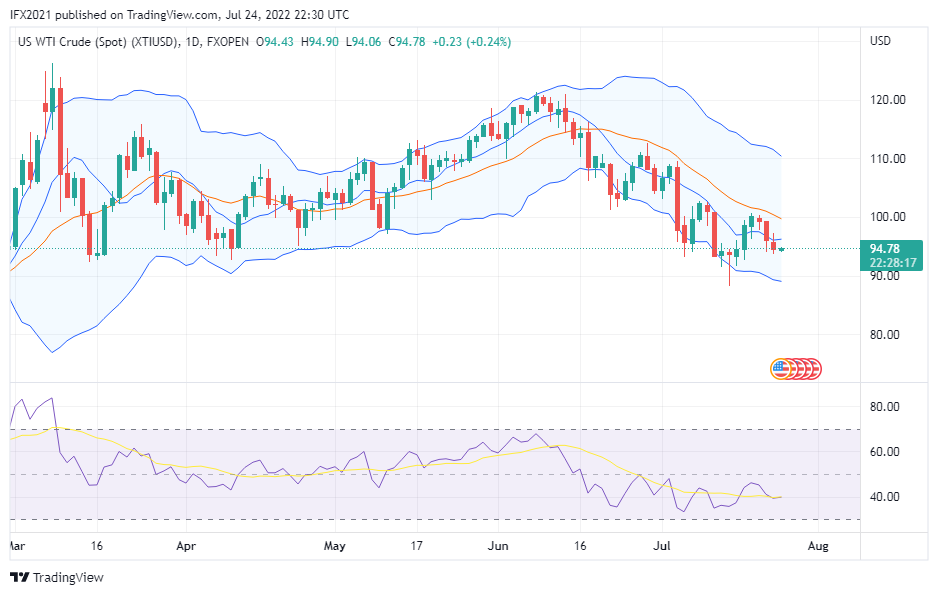
XTIUSD price at the time writing at 100.61 based FXOpen chart in Tradingview. Oil prices get a rejection at the MA line and have not yet crossed the line and bringing the price drops -by 0.45%.

News oil today about Russia is still using oil as a weapon against Europe, which has imposed an embargo on that country. Russia's plan to cut off Kazakh oil supplies to Europe was cited in Oilprice.

XTIUSD based daily timeframe, now the price still below MA line and middle band line, indicates downtrend still on the way, the price still moves on trading range middle band and lower band line. While the RSI level shows 41 shows a downtrend signal.

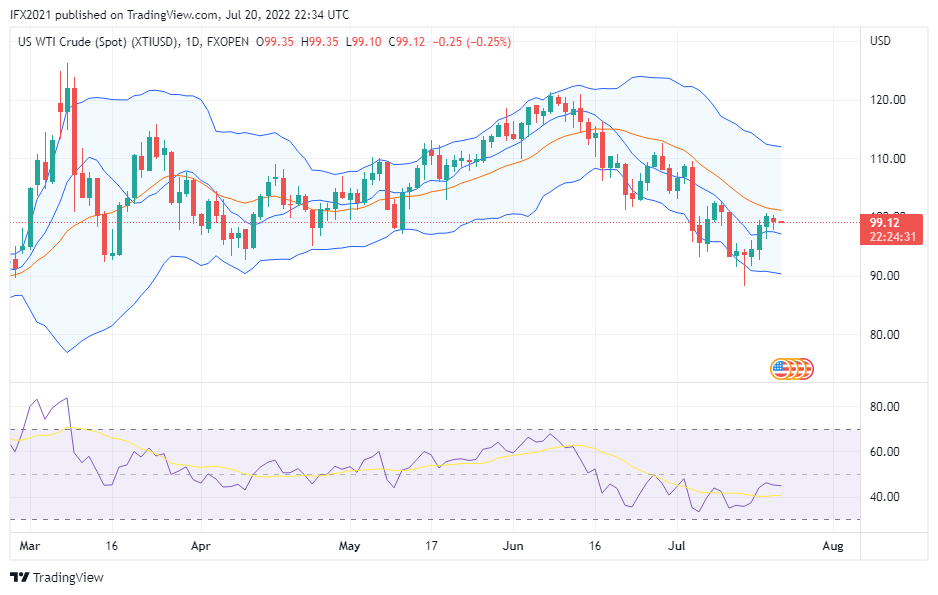
H1 timeframe, oil price below MA line indicates downtrend based indicator, while Bollinger band squeeze means low volatility occurs on this timeframe. RSI level show 50 indicates a neutral trading signal in this timeframe.
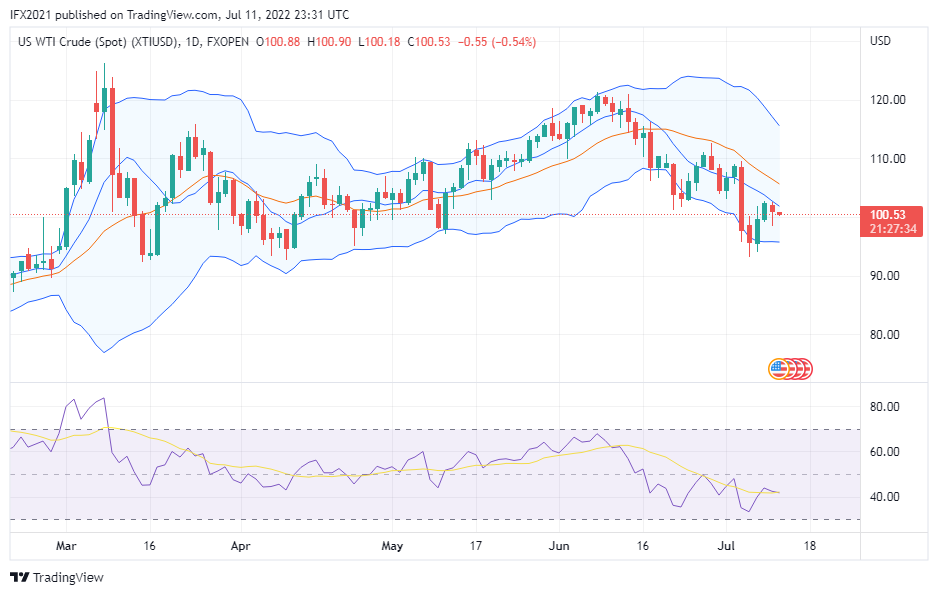
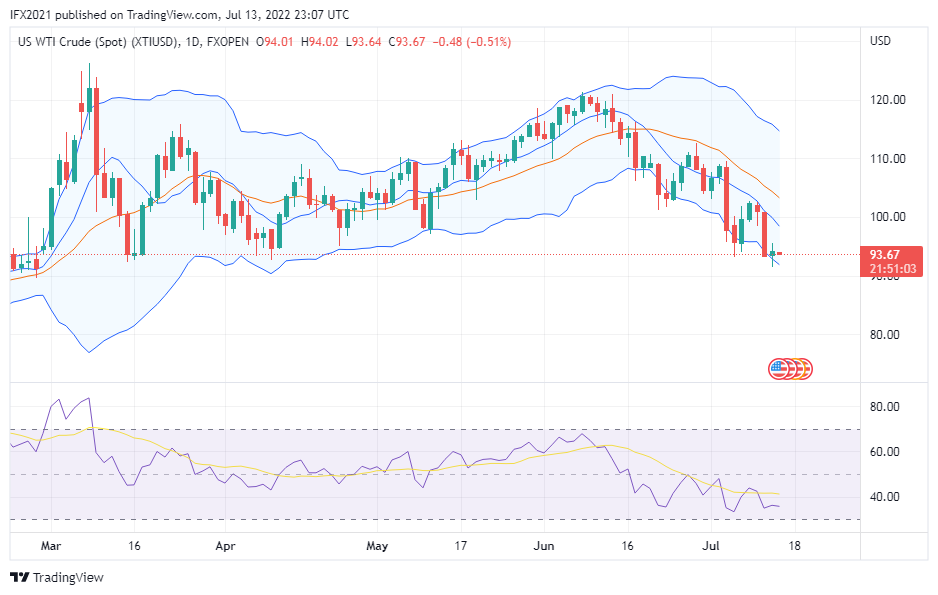
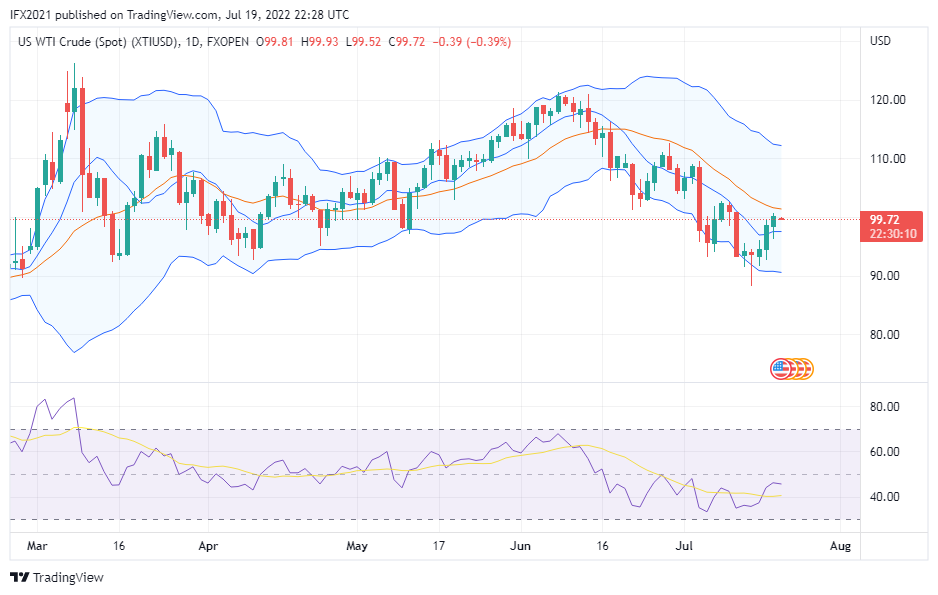
JGMnEpzd.png
 
Hello everyone, have a nice day. Hope all traders and members of FPA will be successful.

Today XTIUSD price is back to below $100, at the time of writing oil price shows 92.06. The price eventually drops after moving above $100 and reaching the MA line. On these levels get a rejection and now the price drops heavily.

News about oil, from an unnamed official, wrote that the idea of price caps was to set a price for Russian oil that covers the marginal cost of its production as a way of motivating Russia to continue exporting that oil, even at prices significantly lower than international prices.

Daily timeframe now prices near the lower band and the price break the line. While the RSI level shows 34 below the SMA line means a downtrend near the oversold zone level. The price leaves MA line very far which means a strong downtrend.

H1 timeframe, MA line indicates downtrend and the price below the line, while Bollinger band expanding as increase volatility, the price also below middle band line. While the RSI level shows16 below the SMA line indicates a downtrend already entering the oversold zone level.

iCWjnSXS.png
 
Hello everyone, have a nice day, Hope all trader's FPA members will profitable.

Oil price today still moves below $100, brawny USD influenced in the financial market, including oil price. Based XTIUSD chart FXOpen in Tradingview, the oil price is now 93.67. with low price yesterday 91.51.

Citing to Oilprice, OPEC they make forecasts oil demand slow down from 3.36 million BPD in 2022 to 2.7 million BPD in 2023. While they expect oil hit a demand of 103 million BPD in 2023.

The daily timeframe in technical analysis, oil price now still moves near the lower band, if yesterday's price break the line, now the price tries to enter the line. While the MA line is still far above the price indicates a strong downtrend occurs. RSI line indicator shows level 35 below SMA line indicates downtrend based indicator near oversold zone level.

H1 timeframe as short term analysis, oil price now moves below MA line and middle band line, but Bollinger band narrow as low volatility occurs based hourly timeframe. Upper band line level 94.99 and lower band line 92.82. RSI level 43 indicates the downtrend in weak movements.

r7V7jIR8.png
 
Hello everyone, have a nice day, hope all trader's FPA members will be profitable.

XTIUSD price shaped low point at 88.23. Current oil price 93.24 at time writing based XTIUSD chart FXOpen in Tradingview.

Oil price still struggles to reach 100 level price, even the price drop and shaped lower on yesterday market. There is a pin bar candle that occurs on a daily timeframe. The oil price now enters to trading range in the Bollinger band line.

In oil news today, Goldman Sachs still predicts oil prices bullish for the long term. While crisis of energy occurs in Pakistan as soaring energy prices on this country. Not only energy crises, Pakistan is also shadowed by economic crises. Many argue Rusia war vs Ukraine become the reason for soaring energy prices.

Daily timeframe XTIUSD now the price still below MA line and middle band line, means downtrend based indicator, while RSI level 34 below SMA line indicates downtrend near oversold zone level.

H1 timeframe oil price above MA line and middle band line, MA line trying to cross middle band as signaling reversion. Bollinger band expands as increase volatility. While RSI level 52 above the SMA line indicates uptrend-based indicator and timeframe.
fRUQF4uD.png
 
Hello world, have a nice day for everyone. Hope all trader FPA members will profitable.

Oil price today is still below 100, the price at the time of writing based FXOpen chart in Tradingview is 94.12, it is fall -0.43%.

The previous week's oil price traded below 100 with a shaped new low of 88.23. The price now in the consolidation stage, and the price is still below the MA line.

Hot news tied to energy is Investment in nuclear fusion exploding on this year. Oilprice states there are new investments $2.8bn in the past 12 months, the company like Tokamak Energy and First Light Fusion, both based in Oxford get prospects in order to breakthrough clean energy.

Oil price still moves below the MA line and middle band line means on the daily timeframe, the trend still tends to be bearish. However, the price at the lower band zone is an early warning for a reversal pattern. RSI level 35 still below the SMA line indicates a downtrend not yet reached the oversold zone level.

H1 timeframe, Oil price now at MA line try to cross down, Bollinger band in flat line indicates sideways where price moves on trading range lower and upper band line. RSI level shows 61 crosses down SMA line indicates in the uptrend the price trying to push down.

XTYR8gw7.png
 
Hello everyone, have a nice day, wish to all traders FPA members will become profitable.

Oil price today still moved below 100 level price, at the time writing oil price 98.42 based XTIUSD chart FXOpen in Tradingview, although still below 100 price level the price cross up MA line, means there are buying pressure increase yesterday.

News related to oil today, the high inflation rate in the US maybe will make The Fed hike interest rate aggressively, this may be impacted for global market including oil prices amid tight oil in the market.

When the Fed raises the interest rate, a chain effect will high to industry sector economy, because credit loans will take higher interest rates, companies will be limited to take loans,s and probably can lead to recession, citing from WSJ article.

Oil price in daily timeframe now shows the price already cross up MA line but still below middle band line. RSI level 41 above the SMA line indicates in a downtrend the price trying to push up. Bollinger band itself still moves down direction.

H1 timeframe the price crossed down MA line but is still above middle band line, on this timeframe last few hours the price movement tends to moves on the small trading range as consolidation. RSI level 63 crosses down the SMA level as a reversal signal-based indicator. While the Bollinger band expands as increase volatility.

6E2c3Q3Y.png
 
Hello everyone, have a nice day, with all traders FPA members will become profitable traders.

Oil price today is still below the 100 level, at the time of writing oil price is 99.73. but the price already formed high 100.66 and low 96.24. The price already crosses up the MA line but is still below the middle band line.

There is news tied to oil today citing from Reuters, President Vladimir Putin says could reduce the capacity of the Nord Stream 1 gas pipeline as the single largest hub of Russian supplies to Europe because of the slow progress of maintenance equipment.

Daily timeframe XTIUSD now the price already cross up MA line and near middle band line, the price shaped high 100.66 and bounce to the current price level. Bollinger band still looks wide between the upper band and lower band indicating still high volatility. RSI level show 44 above the SMA line indicates on the downtrend, there is buying pressure trying to control.

H1 timeframe, the price above MA line, and trying to cross down, MA line above middle band line indicates an uptrend, while Bolinger band expands, there is increased volatility, RSI level show61 trying to cross down SMA line indicates in an uptrend there is selloff pressure on this timeframe.

DpDtJw2a.png
 
Hello everyone, have a nice day, I wish all traders FPA members will be profitable for a lifetime.

Oil price today still moves below 100 level price. Oil price at the time writing at 99.12 based XTIUSD chart FXOpen in Tradingview, yesterday low 97.71 and high 100.24. The price does not differ much compared to the previous day's market.

There is news related Oil on Europe, Gazprom will renominate gas flows, for July 21st at 30% capacity for the Nord Stream 1 pipeline, this may reduce worry to Russia cut off gas flows to Europe as Putin says if slow down progress maintenance may be impacts to supplies on . Europe.

Daily timeframe, oil price now still move above MA line and below middle band line. This means that based on MA the current trend is still an uptrend, but the middle band may act as the first resistance. While the RSI level shows 43 above the SMA line indicates in the downtrend market there is the possibility of reversal to an uptrend.

H1 timeframe, price in consolidation, small range movement looks on a few hours back. Bollinger band narrow as decrease volatility, while MA line and price move in one line as a flat market.

saefzt9R.png
 
Hello everyone, hope you all doing well today.

Oil prices still struggle to wake up, the price still moves below the 100 level price. At the time of writing oil price at 95.76 formed a high at 99.35 and a low of 94.08. Oil prices failed to break the middle band line, even cross down the MA line.

Global news about geopolitics is still high in tension between Western vs Russia, according to Oilprice, the US sends more weapons to Ukraine to help. The war is still not yet over and this can lead the war longer time.

The news, Russia will not sell oil if the price cap is below production cost in discussions.

Oil price on the daily timeframe shows below MA line indicates downtrend based indicator, while Bollinger band line still wide range and slope down indicates there is high volatility in a downtrend market. RSI level shows level 40 indicates downtrend.

H1 timeframe, last three hours oil price move on the narrow market, and the price below MA line indicates downtrend based indicator, while Bollinger band wide range start to shaped flattening line. RSI level38 above the SMA line indicates in a downtrend, there is buying pressure trying to control.

5Na7PdVQ.png
 
Hello everyone, back to the FPA forum, wish all traders will be profitable on the journey.

Oil price today still moves below 100 level price, at the time writing oil price 94.78 based XTIUSD chart FXOpen in Tradingview. Oil price now moves below MA line, but still low volatility market.

News related energy today citing to Oilprice, Carbon emission track all-time high, increased 5.6% during Covid-19 2020-2021.

Oilprice.png


What're means? If carbon emissions become a hot topic among leaders of world countries, its possible impact on oil demand, and transition to green energy will be soaring on a few years later.

Oil prices today are still below 100 level price and land at 94 level price. The price still moves below the MA line and middle band line, which means downtrend based indicator. RSI level 40 flattening to SMA line indicates in downtrend market there is no signal.

H1 timeframe, oil price move near the lower band and formed bulls pattern, but the price still below MA line and middle band line, volatility quite high on this timeframe marked by wide range Bollinger band line, while RSI crosses up SMA line indicates an uptrend in a downtrend market.

itTYgZZC.png
 
Back
Top