fxoday
Recruit
- Messages
- 884
Hello everyone has a nice day, and come back again to the community.
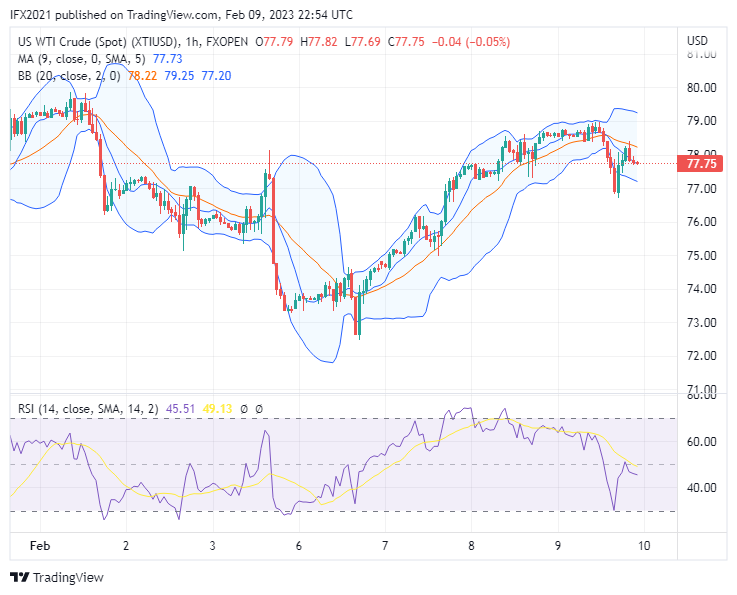
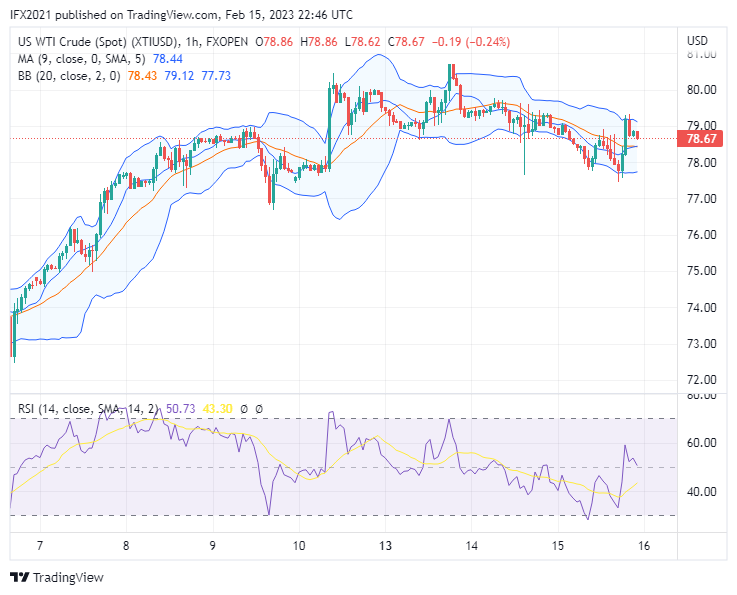
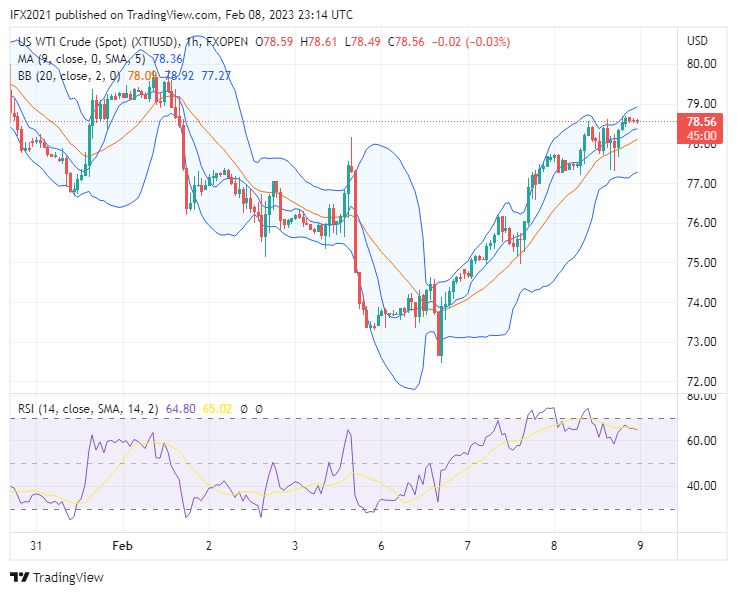
Oil price looks to rise again today's price is 78.56 based XTIUSD chart FXOpen in the Tradingview.
News related to oil today citing to Oilprice, Iran expects Oil price will reach $100 when China's demand has rebound, another news Oil price is up as Fed proves less hawkish.
Powell said he saw indications that inflation is cooling. That statement came just days after the Fed raised its benchmark interest rate a quarter percentage point to 4.5%-4.75%.
XTIUSD Technical analysis
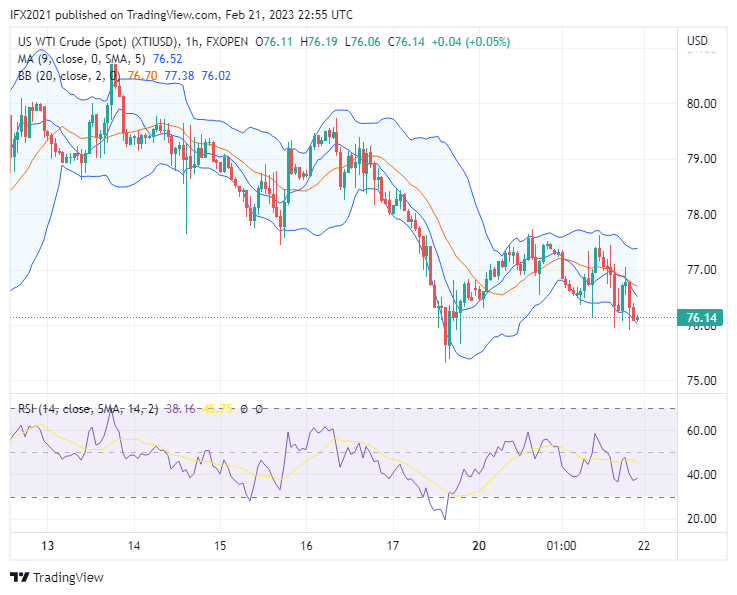
Oil price moves near the middle band line and moving average in the center or trading range. Oil price looks consolidating as doubted market the price will rise or down. The resistance level-based upper band is roughly 82.90 and the support zone is near 72 level prices. Bollinger band still draws a flat line indicating the price is still in the trading range. RSI indicator shows level 51 which means above the uptrend zone level.
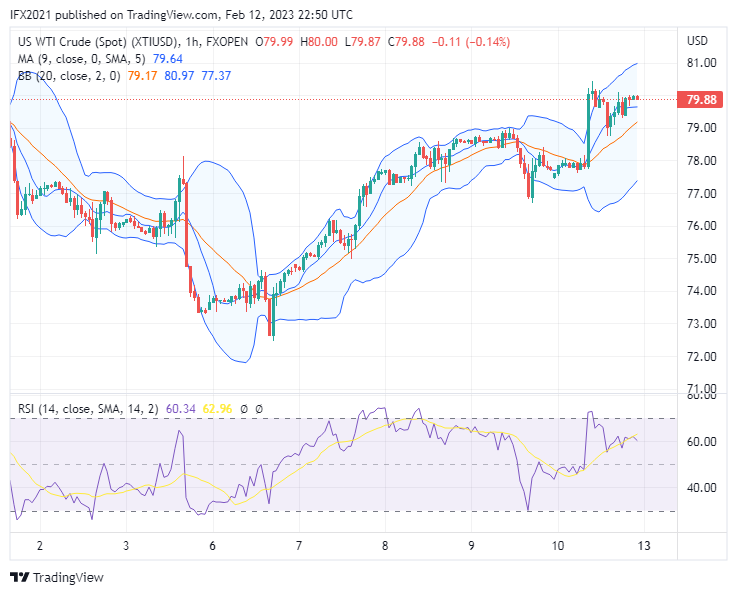
In the hourly timeframe, oil prices now move above the moving average near the upper band line. The MA line shows ascending line indicating an uptrend market occurs, however, the Bollinger band draws a narrow range indicating lower volatility. RSI level shows level 64 below the overbought zone level.
FXO Markets Ltd Disclaimer: CFDs are complex instruments and come with a high risk of losing your money.
Oil price looks to rise again today's price is 78.56 based XTIUSD chart FXOpen in the Tradingview.
News related to oil today citing to Oilprice, Iran expects Oil price will reach $100 when China's demand has rebound, another news Oil price is up as Fed proves less hawkish.
Powell said he saw indications that inflation is cooling. That statement came just days after the Fed raised its benchmark interest rate a quarter percentage point to 4.5%-4.75%.
XTIUSD Technical analysis
Oil price moves near the middle band line and moving average in the center or trading range. Oil price looks consolidating as doubted market the price will rise or down. The resistance level-based upper band is roughly 82.90 and the support zone is near 72 level prices. Bollinger band still draws a flat line indicating the price is still in the trading range. RSI indicator shows level 51 which means above the uptrend zone level.
In the hourly timeframe, oil prices now move above the moving average near the upper band line. The MA line shows ascending line indicating an uptrend market occurs, however, the Bollinger band draws a narrow range indicating lower volatility. RSI level shows level 64 below the overbought zone level.
FXO Markets Ltd Disclaimer: CFDs are complex instruments and come with a high risk of losing your money.