fxoday
Recruit
- Messages
- 884
Hello everyone, have a nice day, volatility gives hope and fears, just take the hope and release the fear.
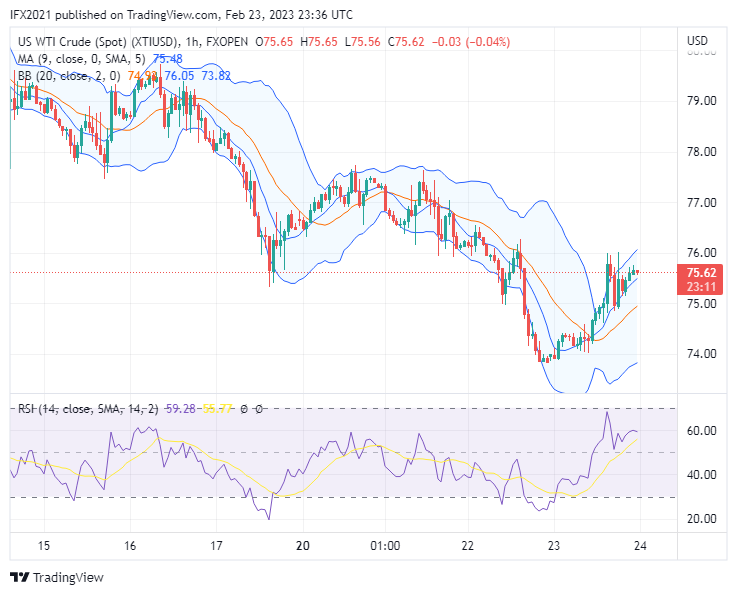
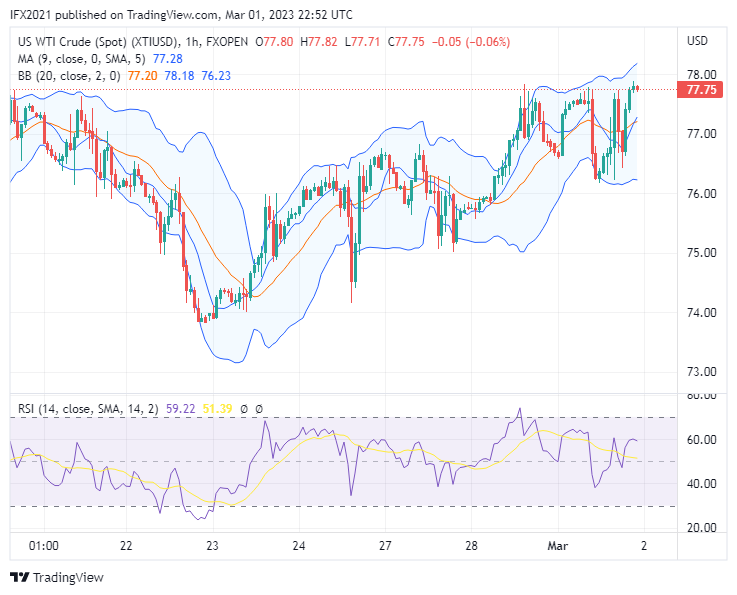
Oil prices declined on yesterday's market, the price formed a new low of 73.75 which works as a support zone level.
There is news today citing Oilprice, Russia sending more Artic crude to India and China.
XTIUSD technical analysis
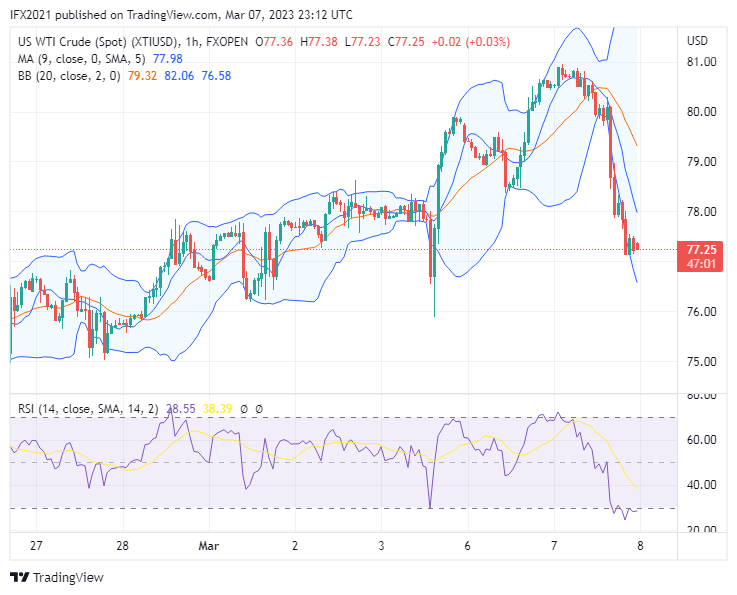
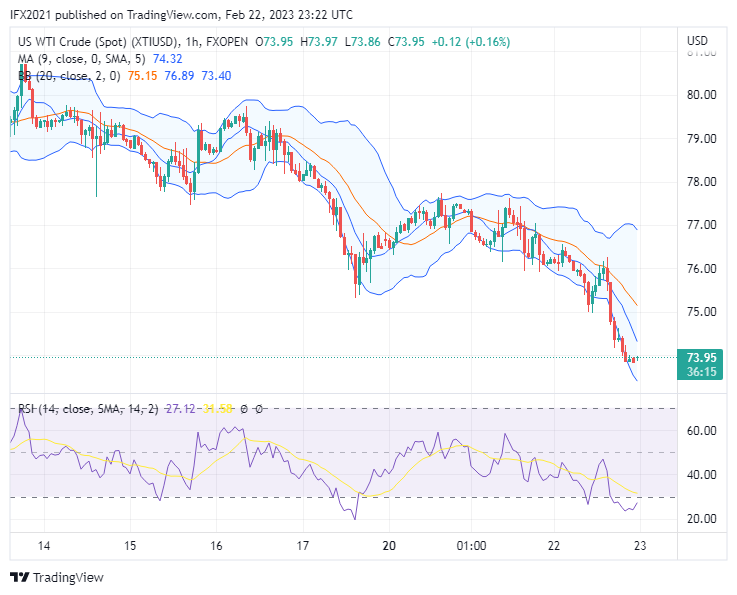
Oil price today is 73.95 based on the XTIUSD chart FXOpen in the Tradingview, oil price continues its previous drop and hit a lower band.
Oil price now moves near the lower band which here is the first support zone based on the Bollinger band, If the price breaks the line, could make oil price sink deeper. Here RSI shows the number of 39 which means the price is below the downtrend zone level.
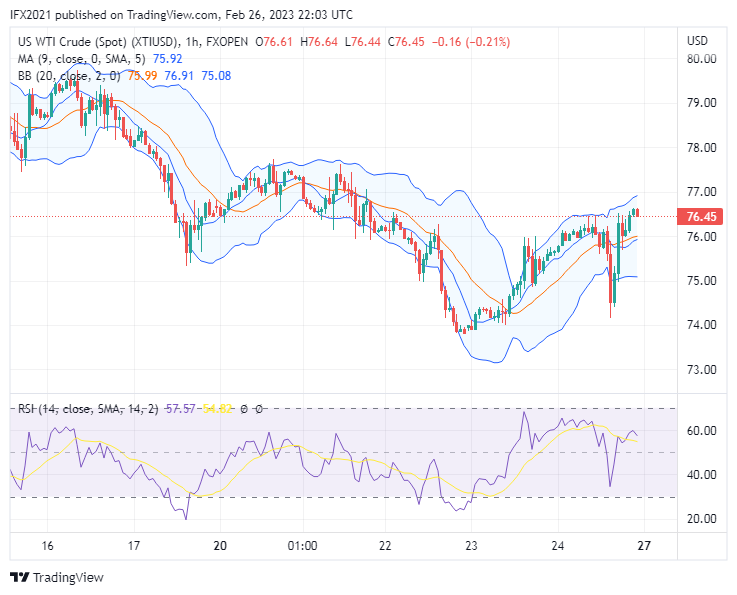
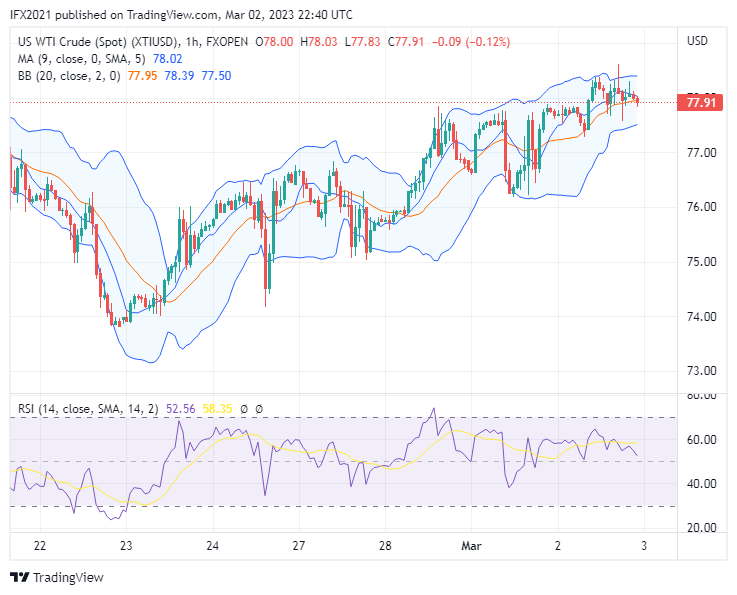
In the hourly timeframe, the oil price success breaks the lower band line, and the band expands which means increase volatility. Oil prices now move near the lower band line, and are still below the moving average which means still in a downtrend-based indicator. While RSI gives an early warning for retracement because the level already shows an oversold zone at number 27.
Disclaimer: CFDs are complex instruments and come with a high risk of losing your money.
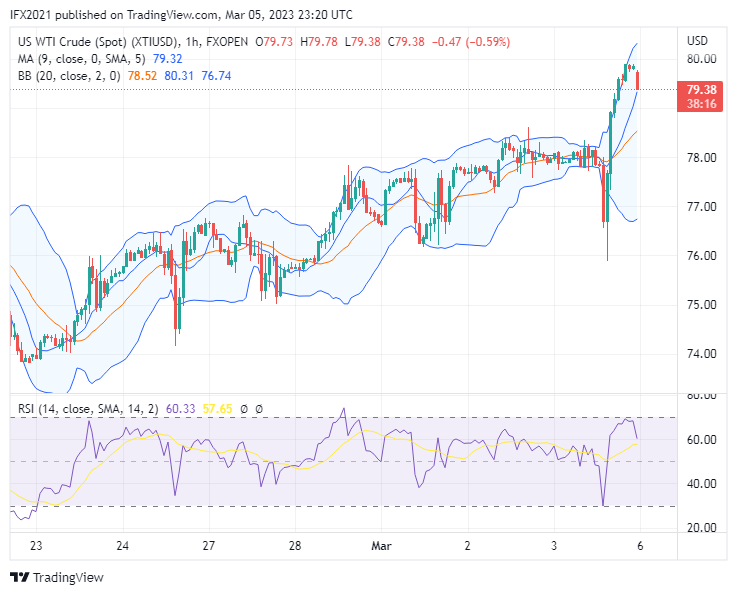
Oil prices declined on yesterday's market, the price formed a new low of 73.75 which works as a support zone level.
There is news today citing Oilprice, Russia sending more Artic crude to India and China.
XTIUSD technical analysis
Oil price today is 73.95 based on the XTIUSD chart FXOpen in the Tradingview, oil price continues its previous drop and hit a lower band.
Oil price now moves near the lower band which here is the first support zone based on the Bollinger band, If the price breaks the line, could make oil price sink deeper. Here RSI shows the number of 39 which means the price is below the downtrend zone level.
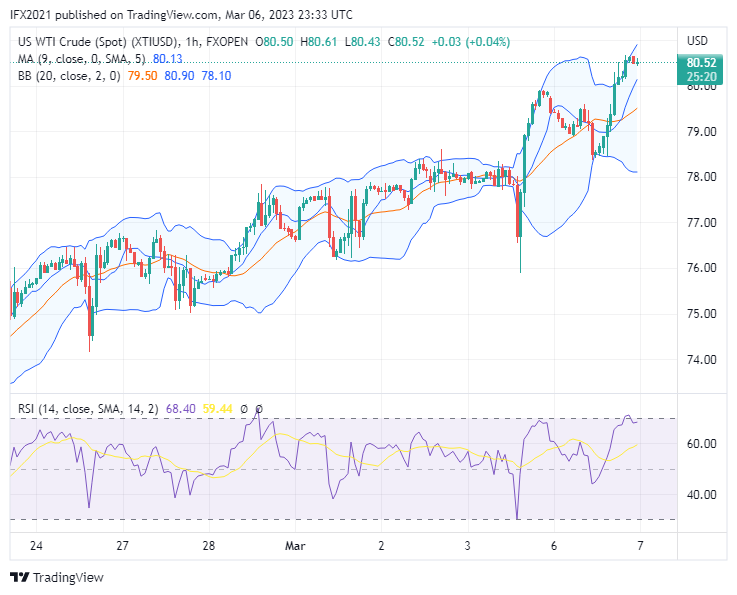
In the hourly timeframe, the oil price success breaks the lower band line, and the band expands which means increase volatility. Oil prices now move near the lower band line, and are still below the moving average which means still in a downtrend-based indicator. While RSI gives an early warning for retracement because the level already shows an oversold zone at number 27.
Disclaimer: CFDs are complex instruments and come with a high risk of losing your money.