2023 Market Forecast by Solid ECN

GBPUSD's Pullback: An Opportunity?​

GBPUSD-H4.png


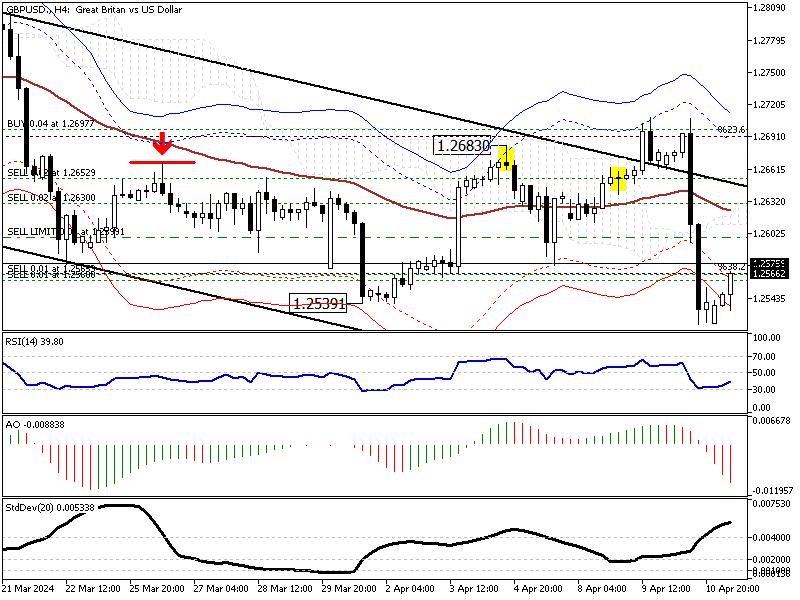
Solid ECN—In yesterday's trading session, The GBPUSD pair dipped below 1.2593, April's lowest point against the U.S. dollar. As of writing, the pair is experiencing a pullback toward the broken support at 1.2575. This pullback was expected because the price exceeded the envelope indicator's lines, interpreted as an oversold market.

From a technical perspective, the market is bearish as long as the GBPUSD price hovers below the Ichimoku Cloud and the EMA 50. The pullback can provide opportunities to join the bear market if it stops at the 1.2575 resistance, followed by 1.2613. Therefore, monitoring these levels and looking for bearish candlestick patterns, such as a doji or a bearish engulfing pattern, can signal investors to join the sellers.

If this scenario comes into play, the next target for the bears will likely be the 50% Fibonacci level, the 1.247 mark, followed by the lower band of the bearish flag.

Conversely, if the GBPUSD closes and stabilizes itself above the cloud and the upper band of the flag, the bear market should be considered invalid.​
 

Frankfurt's DAX 40 Dips as ECB Holds Rates, US Inflation Data Surprises​

EURUSD-H4.png


Solid ECN – On Thursday, the DAX 40 index of Frankfurt saw a slight decrease of 0.2%, closing at 18,090 points. This happened right after the European Central Bank decided to keep its primary interest rates the same. The bank also mentioned it might lower rates if it looks like inflation is going to drop based on future projections.

However, President Lagarde was clear that the ECB hasn't promised to follow a set path for interest rates, stating that any decisions will be based on upcoming data.

In the US, the situation looked a bit different. Reports showed that the growth in producer prices wasn't as strong as people thought it would be. However, the core index for the year was a bit higher than what was predicted.

The day before, on Wednesday, unexpected high US CPI figures made people question if the Federal Reserve could reduce interest rates over the summer. This uncertainty makes it harder for the world's other big central banks to plan for easing.​
 
AUDUSD Recovery and Future Market Trends
AUDUSDH4.png


The Australian dollar has pulled back to 0.6554 (the 38.2% Fibonacci support level) against the U.S. Dollar after yesterday's slump to 0.6499.

From a technical standpoint, the downtrend in the AUDUSD will likely continue if the price holds below the Ichimoku cloud and the 38.2% Fibonacci resistance.

On the flip side, if the AUDUSD price crosses above the EMA 50 level, the bearish analysis should be invalidated, and the market would extend, aiming for the 61.8% Fibonacci resistance level, which is in conjunction with the upper band of the young flag.​
 

Monitoring Yen's Rally Against Sterling​

GBPJPY-Daily.png


Solid ECN – The Japanese yen is making a comeback against the pound sterling from 192.9 and is increasing its pace toward the 23.6% Fibonacci level.

The pair trades in the bullish flag depicted in red, as shown on the daily chart. The current downward momentum occurs while the RSI indicator closes on the 50 levels and the Awesome Oscillator signals divergence. This could be interpreted as a trend reversal or the beginning of a new consolidation phase, which appears stronger.

From a technical standpoint, the primary trend is bullish. Still, due to the divergence signal, the consolidation phase might extend to the 23.6% Fibonacci support, followed by the lower band of the bearish flag in blue.

Therefore, we suggest monitoring the aforementioned levels closely for a hammer stick pattern since these levels provide a decent price point for joining the bull market.​
 

EUR/USD Exchange Rate Forecast: Navigating Through Global Market Signals​

EURUSD-H4.png


Solid ECN—The EUR/USD exchange rate might see some interesting moves this week, influenced by different factors in Europe and the United States.

The mood in Europe is somewhat positive as the stock markets, particularly the STOXX 50 index, increased by 0.6% on Monday. This increase happened because tensions in the Middle East seemed to calm down after Israel successfully defended itself against a major air attack from Iran. Additionally, the US has reassured everyone that it wants to avoid any more significant conflict in that region. These developments have made investors feel more secure, which is suitable for the markets.

On the business side in Europe, there were some mixed signals. Portugal’s GALP Energia saw its oil and gas production drop by 9% from the previous quarter, which might raise some concerns about energy supplies. However, there were also some big deals, like France's BNP Paribas buying a significant stake in Belgian insurer Ageas and Italy’s Prysmian acquiring Encore Wire for $4.2 billion. These moves could show confidence in European companies and might support the euro.

In the United States, investors are very focused on what the Federal Reserve will do next. Fed officials are planning speeches this week, and everyone wants to know how the central bank will deal with the tight job market and high inflation. If the Fed signals that it might raise interest rates to control inflation, it could strengthen the US dollar.

Overall, the EUR/USD exchange rate will likely react to how these situations develop. If the European economy shows more positive signs and the US Fed suggests strong measures against inflation, we could see some volatility and essential shifts in the exchange rate. It's a week where traders will need to keep a close eye on news from both sides of the Atlantic.​
 

EURUSD Trading Tips Amid Market Volatility​

EURUSD-H4.png


Solid ECN – The EURUSD currency pair dipped to as low as 1.062 during Friday's trading session and traded at about 1.066, with an increase in today's trading session.

The RSI indicator signals that the market is oversold, while the Standard Deviation indicator hovers at a peak of around 0.0079 and is declining. This can be interpreted as the market being oversold and market volatility slowing down.

From a technical perspective, joining the bears in an oversold market condition is not recommended. Therefore, waiting patiently for the EURUSD to correct some of its losses is logical and wise. However, we don't see signals from the Awesome Oscillator indicating the start of a consolidation phase. Regardless of the AO, if the price reaches the 23.6% Fibonacci level, this resistance area can provide a decent entry point for retail traders to join the bear market.

Please be aware that the Ichimoku cloud stands between bear and bull markets. As long as the price hovers below the cloud, the market remains bearish.​
 

Understanding Bitcoin’s Recent Price Recovery​

BTCUSDH4.png


Solid ECN—Bitcoin's price has rebounded from the $60,600 resistance, coinciding with the lows of April 5 and 20. This recovery was anticipated as the RSI indicator was previously in oversold territory. As of this writing, the indicator is showing bullish signs, having flipped above the 50 level.

Consequently, the BTCUSD pair remains bullish, although it is currently trading below the Ichimoku cloud. The next bullish target is likely the upper band of the flag around $72,000.

However, the bulls face the EMA 50 as a barrier, suggesting that there might be a consolidation phase or a minor pullback to the 38.2% Fibonacci support level before the uptrend resumes. This is particularly likely, considering the standard deviation indicator is losing momentum.

The $60,600 mark is critical to keeping the market bullish. Should the Bitcoin price dip below this level, the bullish scenario would need to be reevaluated.​
 

Analyzing USDCAD's Recent Overbought Status​

USDCAD-H4.png


Solid ECN – As of this writing, the USDCAD currency pair is trading at about 1.3737, slightly below the 78.6% Fibonacci level. The rise that began on April 4 from 1.3477 has led to the pair becoming overbought. Notably, the RSI indicator highlighted yesterday's saturated market when it hovered above 70.

Subsequently, the USDCAD formed a doji candlestick pattern with a long wick on the 4-hour chart, and interestingly, the Awesome Oscillator is showing signs of a bearish wave.

Therefore, from a technical perspective, the USDCAD price might dip. However, for this to occur, the bears must close and stabilize the price below the 1.3725 minor support. If this scenario unfolds, the correction phase could extend to the 1.3682 broken resistance, which offers a decent entry point to join the bull market.

It is worth noting that the market remains bullish as long as the USDCAD price trades above the EMA 50.​
 

GBPJPY Eyes Resistance at 192.9: Bullish Outlook​

GBPJPY-H4.png


Solid ECN – The GBPJPY price bounced significantly from the 23.6% Fibonacci support and is testing the April high, which is in conjunction with the upper band of the flag, at the 192.9 mark.

As of this writing, the GBPJPY price trades at about 192.2 and is trying to stabilize itself above the Ichimoku cloud. Interestingly, the technical indicators are bullish, with the RSI hovering above 50 and the Awesome Oscillator bars turning green and closing in on the signal line from below.

From a technical standpoint, the GBPJPY is in a bull market if it remains within the bullish flag, marked in red. The price of this trading instrument will likely resume its rise. However, it is noteworthy that for the bullish scenario to play out, the buyers must close above the flag, specifically at the 192.9 resistance.

On the other hand, the 23.6% Fibonacci support stands between the bullish and bearish markets. The bull market is invalidated only if the GBPJPY price dips below this level.​
 

Bullish Gold: Navigating the Upswing with Fibonacci and Technical Indicators​

XAUUSD-H4.png


Solid ECN – The gold price returned upward after it touched the 38.2% Fibonacci level, which coincides with the EMA 50 and the Ichimoku cloud at the $2,324 mark. Interestingly, the XAU/USD 4-hour chart formed a bullish long-wick candlestick pattern, which signals the continuation of the bull market.

As of this writing, the yellow metal is trading at about $2,370, slightly above the 23.6% Fibonacci support. The technical indicators are also bullish. The RSI indicator hovers above the 50 level and the Awesome Oscillator bars are green and above the signal line.

From a technical perspective, as long as the price remains above the EMA 50 and inside the flag, the market trend remains bullish. The next target will likely be April’s high at the $2,432 mark.

Conversely, the bull market is invalidated if the XAU/USD price dips below the 38.2% Fibonacci support.​
 
Back
Top