2023 Market Forecast by Solid ECN

Silver Prices Hold Steady as Investors Eye Fed Moves​

XAGUSD-H4.png


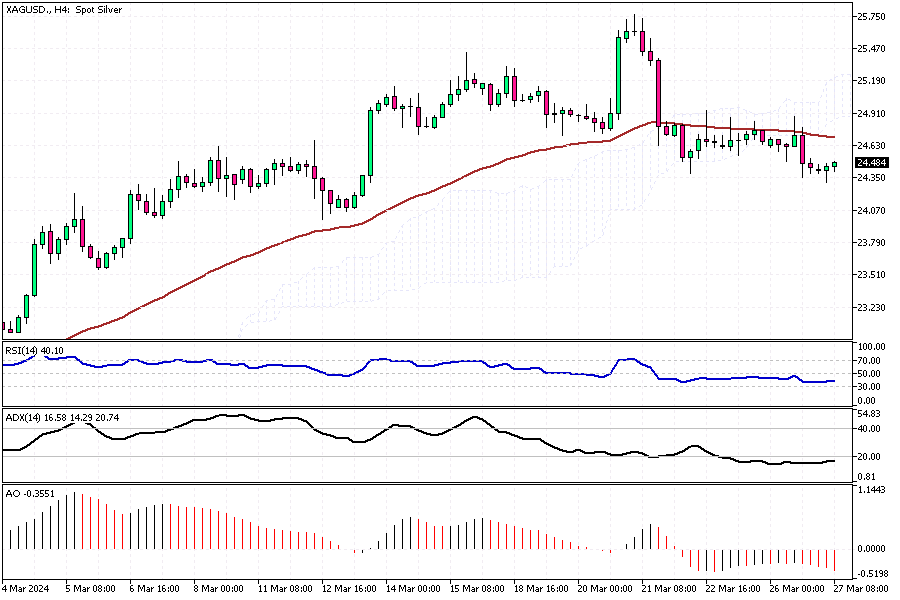
Solid ECN—Silver prices have stabilized above $24.5 per ounce after hitting almost a one-year high on March 20th. This happens while investors wait for speeches from the Federal Reserve's officials and the key PCE inflation data this week. These events will help them predict if the U.S. will start easing its monetary policy soon. Before this, the U.S.'s main financial authority decided not to change its plan for three interest rate decreases in 2024.

This decision made silver and similar assets without yield more attractive. Since their last meeting, the likelihood of reducing interest rates in June has increased to about 70% from the previous 55%. Meanwhile, the Swiss National Bank was among the first big banks to begin reducing its European policies. Silver continues to be supported as a safeguard against global political tensions, mainly due to ongoing conflicts in Ukraine and the Middle East. Recently, Russia has significantly attacked Ukraine's energy infrastructure.​
 

GBPUSD Drops, Awaiting Bank Decisions​

GBPUSD-H4.png


Solid ECN – In late March, the British pound fell to just above $1.26, its weakest since February 19, and was on track to lose almost 1% over the quarter compared to the US dollar. This happened as investors paid careful attention to cautious words from bank officials. Fed Governor Waller mentioned that the latest inflation figures back the idea that the US Federal Reserve might not soon lower its short-term interest rate goal, though he didn't rule out cuts later in the year.

In Britain, Bank of England's Haskel stated that it's too soon to consider rate cuts, and his colleague Mann warned against expecting too many rate reductions this year. She suggested it's unlikely the UK would reduce rates before the US.

During its March session, the Bank of England kept its interest rates the same. Two members, who had earlier supported increasing rates, now preferred to wait, leading to a softer approach than many had predicted.​
 

AUDUSD's Technical Outlook: Pullback Opportunities in Sight​

AUDUSD-H4.png


In today's market, the Australian dollar is losing value compared to the U.S. Dollar. The exchange rate fell below the 0.6503 support level, and it’s currently trading around 0.6493 after a slight recovery from 0.6475.

Despite the bearish trend, the Awesome Oscillator indicates a divergence, suggesting we might soon enter a consolidation phase. This means the AUD/USD pair could temporarily rise, possibly retesting the 0.6503 level and then the 50 EMA, before continuing its downward trajectory.

Technically speaking, the AUD/USD is experiencing a bear market, but there's a chance for a short-term pullback because the Awesome Oscillator is showing divergence. The levels around 0.6503 and 0.6504 could offer good opportunities for those looking to enter the market with this bearish trend in mind.

However, should the pair close above and find stability over the Ichimoku cloud, it would challenge the current bearish outlook and potentially shift the market sentiment.​
 

How to Trade the NZD/USD Pullback: Insights from the Awesome Oscillator​

NZDUSD-Daily.png


The NZD/USD currency pair is in a bear market, trading below the 61.8% Fibonacci resistance level. The ADX indicator signifies that the trend is strong on the daily chart as it nears the 40 level. However, the Awesome Oscillator indicates divergence, suggesting that the New Zealand dollar will likely experience a pullback to the 0.602 resistance area.

Technically speaking, the next bearish target could be the 78.2% Fibonacci level, but the decline may continue after a consolidation phase. Therefore, the 0.602 level can provide a decent entry point for joining the sellers in the NZD/USD market.
 
Navigating the Bear Market: Entry Points for EUR/USD Traders

EURUSD-H4.png


Solid ECN – The U.S. Dollar is stabilizing below the 38.2% Fibonacci level against the European currency today, Monday, April 1st, 2024.

The divergence signaled by the Awesome Oscillator could indicate a potential consolidation phase on the horizon.

From a technical perspective, the primary trend for EUR/USD is bearish. The pair will likely regain some of its losses from last week by rising to the 50% Fibonacci level, which coincides with the EMA 50. This resistance level could provide a suitable entry point for retail traders looking to join the bear market.

Conversely, the bear market should be invalidated if the pair stabilizes above the Ichimoku Cloud.​
 

Oil Prices Peak Ahead of OPEC+ Meeting​

USOUSDDaily.png


Solid ECN – On Monday, WTI crude oil prices climbed to about $83.5 a barrel, reaching their highest point in five months. This surge comes as investors eagerly await the upcoming joint ministerial OPEC+ meeting this week. At this meeting, the group plans to examine the current state of the market and how well members are sticking to their production goals.

They are expected to decide to keep their current production levels the same. The Russian Deputy Prime Minister Alexander Novak mentioned last Friday that Russian oil companies should focus more on reducing their oil production than their exports during the second quarter. This is part of Russia's efforts to align with OPEC+'s production targets.

In addition, the market is also paying close attention to how Ukrainian drone attacks on Russian oil facilities and the peace negotiations in Gaza might affect the oil supply.

On the demand side, there's some positive news: recent data revealed that China's manufacturing sector grew in March for the first time in six months, a development that could mean stronger demand for oil from the world's largest importer of crude oil.​
 

GBPUSD: New Trends and Bearish Targets Unveiled​

GBPUSD-H4.png


Solid ECN — The GBPUSD traded within a narrow range last week. The ADX indicator, hovering above the 25 level, suggests a new trend is likely on the horizon. Since the U.S. Dollar broke through the 50% Fibonacci resistance level, it appears that the downtrend that began in early March is set to continue.

The next bearish target is expected to be the flag's lower band, followed by the 38.2% Fibonacci support level.

Please note that the bear market will be invalidated if the price rises above the Ichimoku Cloud.​
 

Bitcoin Tests the Bullish Trendline for Next Moves​

BTCUSDH4.png


Bitcoin's price dipped to as low as $65,796 in today's trading session against the U.S. dollar. As of this writing, the pair is testing the ascending trendline highlighted in red. The technical indicators are not providing valuable information now, so we focus on price action analysis.

From a technical perspective, the trend remains bullish as long as the price stays above the red trendline. However, if bears push and maintain the BTC/USD price below this trendline, the dip could extend further, with the next bearish target potentially being the $68,000 resistance level.
 

USDCNH Bullish Trend Analysis: Key Levels to Watch​

USDCNH-Daily.png


Solid ECN – The U.S. Dollar has been in an uptrend since mid-December 2023 against the Chinese Yuan. As of this writing, the USDCNH pair trades at about 7.26, slightly above the 61.8% Fibonacci support level and the 7.23 higher low.

The technical indicators are bullish. The RSI hovers above the median line and the Awesome Oscillator bars are green and above the signal line.

From a technical standpoint, the pair is in a bull market, with 7.23 acting as support. Therefore, while the price holds above this level, the next bullish target could be the 78.6% Fibonacci resistance level.

Conversely, if the USDCNH price dips below the 7.23 support, the decline is likely to extend to the lower band of the bullish flag, which is in conjunction with the Ichimoku Cloud. Please note that the trend remains bullish as long as the pair ranges above the cloud.​
 

USD/JPY Eyes Key 151.9 Resistance Level​

USDJPY-H4.png


The U.S. Dollar trades slightly lower than the 151.9 mark against the Japanese yen in today's trading session. The pair has been ranging below this area for two weeks now, and the trend hasn't developed any significant moves lately.

However, bullish traders are keen to see the pair break above the 151.9 ceiling, which could lead to the U.S. price experiencing another jump against the Japanese currency.

Therefore, from a technical standpoint, the primary trend is bullish while the pair hovers above the 23.6% Fibonacci support level. The uptrend will continue if the bulls break above the resistance level, the 151.9 mark.
 
Back
Top