2023 Market Forecast by Solid ECN

Recent Trends in NZDUSD​

NZDUSD-Daily.png


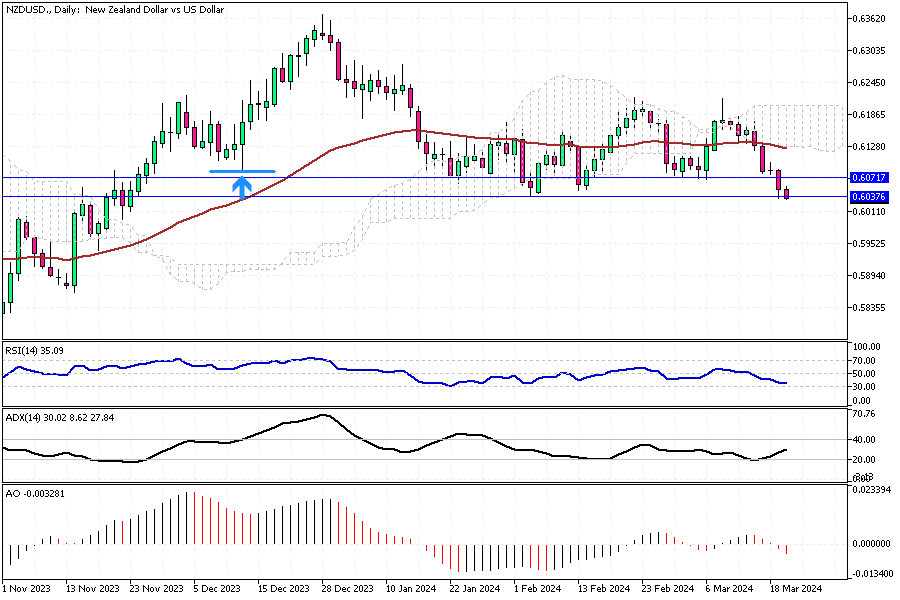
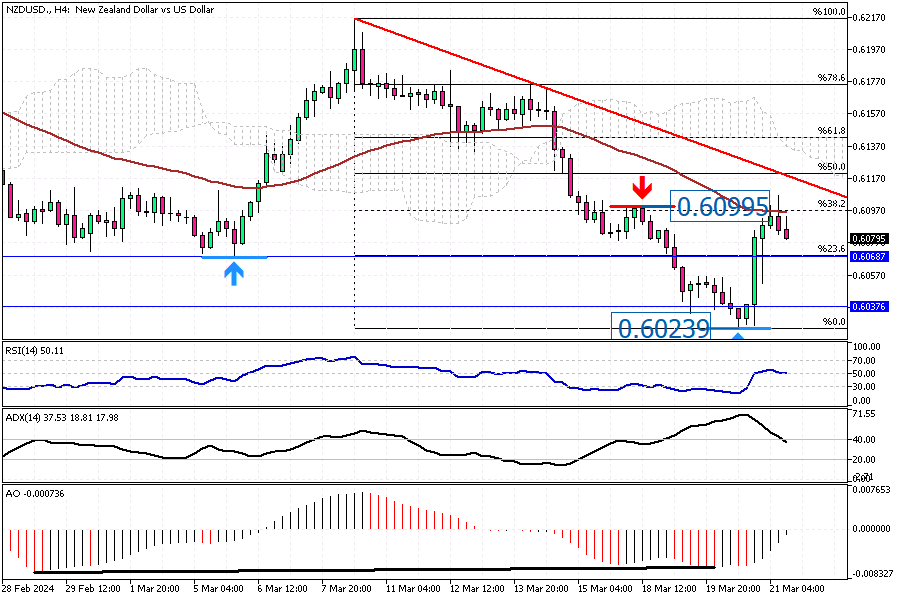
Solid ECN – The New Zealand dollar fell below $0.605, reaching close to its four-month low following the Australian dollar's downturn. This happened after the Reserve Bank of Australia decided not to change interest rates, a decision many anticipated. They also removed their previous caution against ruling out future rate hikes. Meanwhile, the Kiwi dollar faced additional pressure due to the upcoming policy meeting of the US Federal Reserve. There's the worry that persistently high inflation in the US might postpone any cuts in Fed rates.

Furthermore, within New Zealand, the expectation is growing that the Reserve Bank of New Zealand may reduce its policy rates starting in August as the rise in prices begins to slow down. As investors wait, they are particularly interested in the upcoming report on the country's economic growth, hoping it will offer more clarity.​
 
Euro Rises as Central Banks Discuss Future Rate Cuts

EURUSD-H4.png


Solid ECN – On Wednesday, the euro climbed to $1.09, bouncing back from its lowest point in two weeks after the Federal Reserve decided not to change its plans for interest rate reductions in 2024. The Fed did not alter interest rates in March, meeting expectations, and hinted at three possible decreases later in the year. Also, the ECB's President Lagarde emphasized in an earlier meeting that they would look at reducing rates in June.

She added a note of caution, stating that the European Central Bank wouldn't lock itself into a set number of cuts, as future decisions will be based on the latest data. Central bank leaders from five countries—Spain, the Netherlands, Ireland, Greece, and Slovakia—have expressed their support for action in June.​
 

Bitcoin's March 2024 Rebound: Analyzing the Latest Price Movements​

BTCUSDH4.png


Solid ECN – Bitcoin bounced from its March 2024 low, the $60,700 mark, in yesterday's trading session, Tuesday.

As of this writing, the BTCUSD pair trades at about $67,700, slightly below the Ichimoku Cloud. The 4-hour chart shows that digital gold is trying to stabilize the price above the EMA 50, while the Awesome Oscillator and the RSI have flipped above their signal lines. Therefore, the technical indicators are bullish, but the Bitcoin bulls face the $68,900 barrier to overcome if they wish the price to surge higher.

From a technical standpoint, the downtrend will likely extend if the price stabilizes itself below the EMA 50. This attempt hasn't been achieved so far in today's trading session. Therefore, watch the EMA 50 on the BTCUSD 4-hour chart.

Conversely, the uptrend would continue if bullish traders break the aforementioned barrier. In this scenario, the March higher high, $73,700, would be the initial target for the bull market.​
 

NZDUSD Struggles at the Key 0.609 Mark​

NZDUSD-H4.png


Solid ECN – In today’s trading session, the NZDUSD currency pair has risen from the 0.602 resistance area and is currently testing the 50-day EMA at the 0.609 mark.

The Awesome Oscillator has predicted the uptick in the momentum of the New Zealand dollar, as evidenced by the divergence shown in the 4-hour chart. At the time of writing, the U.S. dollar drives the price towards the 0.606 resistance, which aligns with the lower high of March 4 and the 23.6% Fibonacci resistance.

From a technical perspective, the primary trend remains bearish as long as the pair continues to trade below the descending red trendline. In this scenario, the bear market is likely to persist, and a break below the 23.6% Fibonacci support could accelerate the downtrend.

However, if the NZDUSD stabilizes above the 50% Fibonacci resistance, it would invalidate the bear market.​
 

GBPJPY: Potential Entry Points Amid AO Divergence​

GBPJPY-Daily.png


Solid ECN – In the current trading session, the GBP has reached a new high of 193.5 against the Japanese Yen. This peak aligns with the upper band of the bullish flag. Notably, the RSI indicator is nearing the overbought zone and is declining below 70 as of writing. Alongside the RSI, the Awesome Oscillator signals a divergence, suggesting a new consolidation phase may be imminent.

Consequently, the GBPJPY price could drop to 191.3, followed by the 23.6% Fibonacci support level, before initiating a new bullish wave.

These two levels offer a suitable entry point for participating in the bull market. However, the bull market will only be invalidated if the price stabilizes below the 50-day EMA.​
 

British Pound Falls Amid Economic Challenges in the UK​

GBPUSD-Daily.png


Solid ECN – The British pound dropped to about $1.26, marking its lowest point since February 19th. This happened because people in the UK stopped spending more in February, and the head of the Bank of England, Andrew Bailey, suggested there might be cuts in interest rates later this year. The Office for National Statistics reported that shopping numbers in the UK didn't change last month.

This was a significant change from January's 3.6% increase and was different from what people thought would happen; they expected a 0.3% drop. At the same time, Bailey did say there were signs that prices were going up less quickly, but he also said it's essential to be sure before making decisions about how to handle the situation.

The Bank of England decided to keep the cost of borrowing money very high, at 5.25%, the highest it's been in 16 years. They made this decision with almost everyone agreeing, even though two people changed their minds about wanting to increase it. This choice was made after seeing that prices weren't rising as fast as before, which hasn't happened in over two years, but prices are still higher than the bank wants.​
 

EURUSD: Navigating the Bear Market and Identifying Entry Points​

EURUSD-H4.png


Solid ECN – The European currency experienced a significant decline against the U.S. Dollar after failing to maintain its position above the Ichimoku cloud on March 21. The pair is currently trading around 1.081 and is nearing the 23.6% Fibonacci retracement level, coinciding with the 1.079 support level.

The Relative Strength Index (RSI) still has room to enter the oversold territory, suggesting that the decline may continue, potentially dipping below the 30 level as the market approaches the Fibonacci level.

From a technical standpoint, we are currently in a bear market. However, the 23.6% Fibonacci support level may provide a good entry point for bullish traders looking to capitalize on a potential pullback. The rebound is anticipated to start around the 1.079 level and extend to 1.083.

We recommend closely monitoring the EURUSD price action, examining candlestick patterns near the Fibonacci level mentioned above, and adjusting trading strategies accordingly.​
 

USDJPY: November 2023 Highs Revisited, Consolidation Ahead?​

USDJPY-H4.png


Solid ECN – The U.S. Dollar has reached the November 2023 high against the Japanese Yen, hitting the 151.9 mark for the second time this week. However, this time, a long wick candlestick pattern has emerged on the USDJPY 4-hour chart.

Additionally, the Awesome Oscillator shows a divergence in its bars, which could signal an imminent consolidation phase. This could drive the price down to the 150.2 mark, followed by the 38.2% Fibonacci support level, which the 50 EMA supports. These levels provide favorable entry points for retail traders looking to join the primary upward trend.

Conversely, the 151.8 hard resistance level must be breached for the uptrend to continue.​
 

Gold Prices Near Record Highs Amid Rate Cut Expectations​

XAUUSD-Daily.png


Solid ECN – On Monday, the price of gold remained steady around $2,175, nearing its record high of $2,185 set on March 20th. This stability comes amid increasing bets on the Federal Reserve reducing interest rates.

Recently, the Fed kept its forecast, expecting to lower rates three times in 2024, making gold more attractive. Moreover, investors now believe there's over a 70% likelihood that the Fed will cut rates in June, a jump from the 55% probability anticipated before their latest meeting.

This week, all eyes are on important U.S. inflation data and speeches from several Federal Reserve officials for further indications of future monetary policies. Additionally, ongoing conflicts in Russia and the Middle East support gold's status as a reliable safe-haven asset.​
 

Gold Prices Surge Amid Global Tensions​

XAUUSD-Daily.png


Solid ECN – On Tuesday, the price of gold climbed to a new peak, approximately $2,190 per ounce. This increase was mainly due to the weakening of the US dollar. Investors are anticipating rate cuts, especially with the upcoming US PCE price index report expected this Friday. Following last week's announcement by the Federal Reserve, which kept its prediction of three interest rate cuts for the year, gold became more attractive.

However, February saw better-than-expected US durable goods orders, and various Federal Reserve officials have voiced concerns regarding persistent inflation and a strong economy. Currently, there's a roughly 70% expectation among markets that the Federal Reserve will begin to lower rates in June, a notable increase from the 55% likelihood anticipated before their last meeting.

Additionally, rising geopolitical tensions in the Middle East and Eastern Europe, underscored by the UN Security Council's call for an immediate ceasefire in Gaza, bolster gold's status as a secure asset.​
 
Back
Top