SOLID ECN LLC
Solid ECN Representative
- Messages
- 512
ETHUSD: Bearish Trends Below Ichimoku Cloud
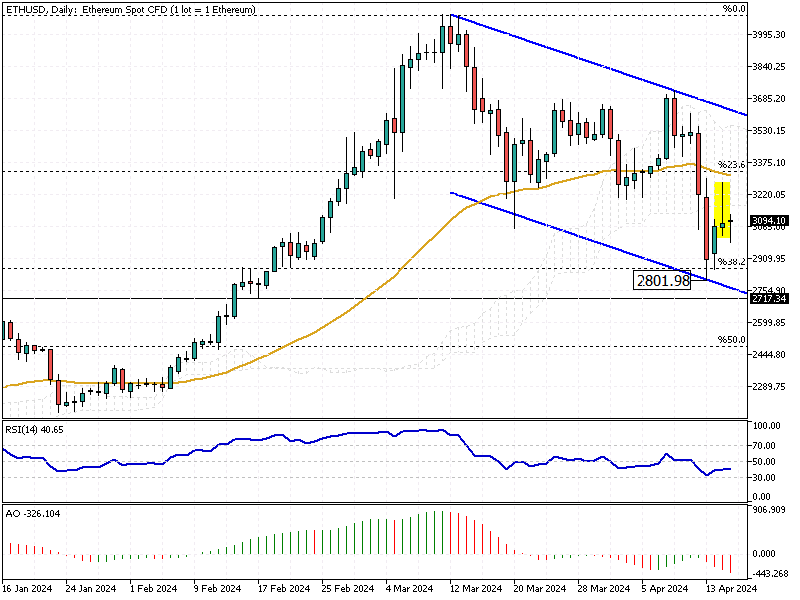
Solid ECN – The ETHUSD price stabilizes below the Ichimoku cloud after pulling back from the 38.2% Fibonacci support level at $2,801. The technical indicators are bearish, with the Relative Strength Index hovering below 50 and the Awesome Oscillator below the signal line, its bars in red.
The ETHUSD chart above shows that the pair trades within a bearish flag. Therefore, from a technical standpoint, the trend remains bearish, and the decline will likely extend to the lower band of the flag, followed by the $2,717 support level.
Conversely, the bull market would be invalidated if the price crosses and stabilizes above the flag.