Daily Market Analysis By FXOpen

Gold Price and Crude Oil Price Aim Fresh Increase
gold.jpg


Gold price started a major decline below the $1,725 support zone. Crude oil price is attempting a fresh increase from the $88.80 support zone.

Important Takeaways for Gold and Oil

  • Gold price struggled above $1,740 and declined against the US Dollar.
  • Recently, there was a break above a key bearish trend line with resistance near $1,705 on the hourly chart of gold.
  • Crude oil price started a downside correction from the $100 and $101 resistance levels.
  • There was a break below a major bullish trend line with support near $98.95 on the hourly chart of XTI/USD.

Gold Price Technical Analysis

Gold price struggled to gain pace above the $1,750 resistance zone against the US Dollar. The price started a fresh decline and traded below the $1,725 pivot level.

There was a clear move below the $1,712 support zone and the 50 hourly simple moving average. The price even traded below the $1,700 level and formed a low near $1,680 on FXOpen. It is now correcting losses above the $1,695 level.

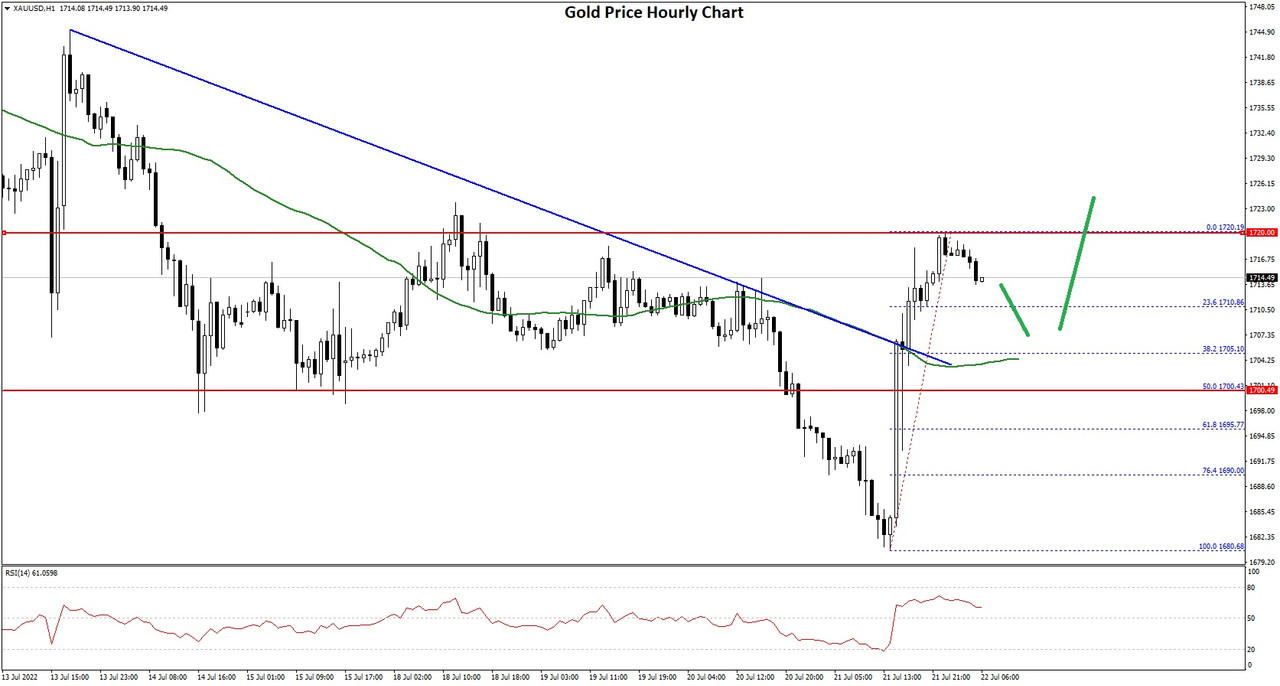
Gold Price Hourly Chart
goldx.jpg


There was a break above a key bearish trend line with resistance near $1,705 on the hourly chart of gold. The price even climbed above the $1,712 level but struggled to clear $1,720.

A high is formed near $1,720 and the price is now consolidating gains. On the downside, an initial support is near the $1,710 level. It is near the 23.6% Fib retracement level of the upward move from the $1,680 swing low to $1,720 high.

The next major support is near the $1,700 level or the 50% Fib retracement level of the upward move from the $1,680 swing low to $1,720 high, below which there is a risk of a larger decline. In the stated case, the price could decline sharply towards the $1,680 support zone.

On the upside, the price is facing resistance near the $1,720 level. A clear upside break above the $1,720 resistance could send the price towards $1,735. The main resistance is now forming near the $1,750 level. A close above the $1,750 level could open the doors for a steady increase towards $1,780.

Read Full on FXOpen Company Blog...
How is that possible that you have price data on 22nd of jul? isnt that weekend?
 
GBP/USD Struggles To Recover, USD/CAD Holds Support
yQBYUna.jpg


GBP/USD is struggling to recover above 1.2665. USD/CAD is holding gains above 1.3560 and might start another increase.

Important Takeaways for GBP/USD and USD/CAD Analysis Today

  • The British Pound started a fresh decline from the 1.2720 resistance zone.
  • There is a major bearish trend line forming with resistance near 1.2620 on the hourly chart of GBP/USD at FXOpen.
  • USD/CAD is correcting gains from the 1.3640 resistance zone.
  • There is a key bullish trend line forming with support near 1.3585 on the hourly chart at FXOpen.

GBP/USD Technical Analysis
RUdGosR.jpg


On the hourly chart of GBP/USD at FXOpen, the pair started a fresh decline from the 1.2720 zone. The British Pound traded below the 1.2665 support to move into further a bearish zone against the US Dollar, as mentioned in the previous analysis.

The pair even traded below 1.2620 and the 50-hour simple moving average. Finally, the bulls appeared near the 1.2550 level. A low was formed near 1.2547 and the pair is now consolidating losses. There was a minor recovery above the 23.6% Fib retracement level of the downward move from the 1.2732 swing high to the 1.2547 low.

Immediate resistance on the upside is near a major bearish trend line at 1.2620 and the 50-hour simple moving average. The first major resistance on the GBP/USD chart is near the 61.8% Fib retracement level of the downward move from the 1.2732 swing high to the 1.2547 low at 1.2665.

A close above the 1.2665 resistance might spark bullish moves. The next major resistance is near the 1.2720 level. Any more gains could lead the pair toward the 1.2800 resistance in the near term.

Initial support sits near 1.2550. The next major support sits at 1.2510 or 1.2500, below which there is a risk of another sharp decline. In the stated case, the pair could drop toward 1.2420.

VIEW FULL ANALYSIS VISIT - FXOpen Blog...

Disclaimer: This article represents the opinion of the Companies operating under the FXOpen brand only. It is not to be construed as an offer, solicitation, or recommendation with respect to products and services provided by the Companies operating under the FXOpen brand, nor is it to be considered financial advice.
 
AUD/USD and NZD/USD Signal Downside Continuation
XxjYKwc.jpg


AUD/USD declined below the 0.6450 and 0.6430 support levels. NZD/USD is also moving lower and might trade below the 0.5900 zone.

Important Takeaways for AUD/USD and NZD/USD Analysis Today

  • The Aussie Dollar started a fresh decline from well above the 0.6480 level against the US Dollar.
  • There was a break below a key bullish trend line with support near 0.6430 on the hourly chart of AUD/USD at FXOpen.
  • NZD/USD declined heavily from the 0.5985 resistance zone.
  • There was a break below a major bullish trend line with support near 0.5945 on the hourly chart of NZD/USD at FXOpen.

AUD/USD Technical Analysis
ycXNnVR.jpg


On the hourly chart of AUD/USD at FXOpen, the pair struggled to clear the 0.6500 zone. The Aussie Dollar started a fresh decline below the 0.6450 support against the US Dollar.

There was a break below a key bullish trend line with support near 0.6430. The pair even settled below 0.6430 and the 50-hour simple moving average. The pair is now showing bearish signs and trading near the last swing low at 0.6410.

On the downside, initial support is near the 1.236 Fib extension level of the upward move from the 0.6411 swing low to the 0.6490 high at 0.6390. If there is a downside break below 0.6390, the pair could extend its decline.

The next support could be the 1.618 Fib extension level of the upward move from the 0.6411 swing low to the 0.6490 high at 0.6365. Any more losses might send the pair toward the 0.6320 support.

On the upside, an immediate resistance is near 0.6430. The next major resistance is near the 50-hour simple moving average at 0.6450, above which the price could rise toward 0.6490. Any more gains might send the pair toward 0.6550.

A close above the 0.6550 level could start another steady increase in the near term. The next major resistance on the AUD/USD chart could be 0.6620.

VIEW FULL ANALYSIS VISIT - FXOpen Blog...

Disclaimer: This article represents the opinion of the Companies operating under the FXOpen brand only. It is not to be construed as an offer, solicitation, or recommendation with respect to products and services provided by the Companies operating under the FXOpen brand, nor is it to be considered financial advice.
 
USD/JPY Rate Updates the High of the Year
8yeIcC2.jpg


Yesterday, USD/JPY hit 146.74 for the first time since November 2022. The rise in the rate is facilitated by the growing gap in the policies of central banks: while the Bank of Japan has kept the rate below zero since 2016, the Fed has been raising rates since the spring of 2022.

Moreover, on Friday, Powell said the Fed is ready to continue to remain tough in the fight against inflation. According to CME's FedWatch tool, there is now a 62% chance of a rate hike at the Fed's November meeting, up from 42% a week earlier.

However, the limiting factor for the USD/JPY rate is the power of the Japanese Ministry of Finance. Last year, when the market was at current levels, the authorities intervened in the foreign exchange market, lowering the rate to 140 yen per US dollar.

The USD/JPY chart shows that:


→ the price continues to move within the ascending channel;
→ on Friday, during Powell's speech, the median line was tested, confirming its influence as a support;
→ former resistance at 144.8 also provides support;
→ if the trend continues, the rate may reach the upper limit of the channel — that is, the psychological mark of 150 yen per US dollar.

EjRgyWq.jpg


VIEW FULL ANALYSIS VISIT - FXOpen Blog...

Disclaimer: This article represents the opinion of the Companies operating under the FXOpen brand only. It is not to be construed as an offer, solicitation, or recommendation with respect to products and services provided by the Companies operating under the FXOpen brand, nor is it to be considered financial advice.
 
When Will the Rate Hikes Stop? The Fed Ploughs on at Jackson Hole Despite Economic Progress
xlZ8YjS.jpg


The United States Federal Reserve's consistent dialogue regarding interest rate increases has captured the attention of economists, policymakers, and financial markets worldwide.

Against the backdrop of a US economy that has shown remarkable resilience over the past two years, discussions surrounding interest rates have become a focal point of speculation and analysis. This article delves into the factors driving the Federal Reserve's decisions, the global context, and the implications for the US Dollar.

Steady US Economy and Debt Dynamics

The US economy's performance over the past two years has been characterised by steady growth and surprising resilience, given the substantial national debt that the country holds. Despite occasional fluctuations and challenges, the overall trajectory has been positive. The ability of the US economy to maintain its stability can be attributed to factors such as robust consumer spending, a strong labour market, and the government's targeted fiscal policies.

VIEW FULL ANALYSIS VISIT - FXOpen Blog...

Disclaimer: This article represents the opinion of the Companies operating under the FXOpen brand only. It is not to be construed as an offer, solicitation, or recommendation with respect to products and services provided by the Companies operating under the FXOpen brand, nor is it to be considered financial advice.
 
Bitcoin Trading Volumes Fell to a Minimum of 4 Years
zMwWhnj.jpg


CNBC, citing CryptoQuant agency, reports that:

→ the total volume of bitcoins held on all cryptocurrency exchanges is at its lowest level since 2019;
→ as of August 26, the volume of bitcoin trading on all exchanges was about 130k BTC;
→ a maximum of 3.5 million BTC were traded in 1 day.

Perhaps the decrease in trading volumes is due to a drop in interest due to the uncertainty with the regulation of cryptocurrencies, or the fading of the bullish trend that began from the early days of 2023.

According to JP Morgan analysts, a decrease in open interest may indicate that the price of bitcoin is near a significant low, but the BTC/USD chart suggests that the bearish trend may continue. This is indicated by the descending channel, the outlines of which are becoming clearer.

8oftkSp.jpg


VIEW FULL ANALYSIS VISIT - FXOpen Blog...

Disclaimer: This article represents the opinion of the Companies operating under the FXOpen brand only. It is not to be construed as an offer, solicitation, or recommendation with respect to products and services provided by the Companies operating under the FXOpen brand, nor is it to be considered financial advice.
 
European Currencies Hit New Lows, Precious Metals on the Rise
2CYGr6a.jpg


European currencies, along with the yen and commodity currencies, came under pressure again last week. After Jerome Powell's hawkish talk at the Jackson Hole symposium, GBP/USD fell below 1.2600, EUR/USD broke support at 1.0800, and USD/JPY came close to 2023 extremes near 147. In the event of a breakout of these levels, the upward movement of the USD may increase sharply, which will lead to exponential growth. Conversely, a rebound from current levels could lead to a full-blown correction in almost all directions.

GBP/USD

The British currency, which is sensitive to the risky mood of market participants, broke through important support at 1.2600 last week and set a new August low at 1.2540. Jerome Powell's statements about the Fed's readiness to further raise the rate, if necessary, sharply strengthened the dollar, contributing to the collapse of GBP/USD. Nevertheless, at the beginning of the current five-day trading period, buyers of the pound managed to return the pair above 1.2600 and at the moment they intend to test 1.2700. If bulls meet serious resistance near the range of 1.2600-1.2700, another downward impulse may occur, the target of which will be a test of 1.2400-1.2200. If the pair gains a foothold above 1.2700, the resumption of growth to 1.3000-1.3100 may happen.

VIEW FULL ANALYSIS VISIT - FXOpen Blog...

Disclaimer: This article represents the opinion of the Companies operating under the FXOpen brand only. It is not to be construed as an offer, solicitation, or recommendation with respect to products and services provided by the Companies operating under the FXOpen brand, nor is it to be considered financial advice.
 
EUR/USD Accelerates Gains from 2.5-month Low
oKaOZP4.jpg


This was facilitated by disappointing data on the US labor market. According to the Bureau of Labor Statistics, the number of new vacancies has fallen sharply: actual — 8.8 million, forecast — 9.4 million new vacancies. The last time the value of the indicator fell below 9 million was in the spring of 2021.

The news came as a big surprise, which sent the dollar index down sharply. Accordingly, USD-denominated shares and gold rose, as well as exchange rates traded against the dollar.

Qs9Xz8d.jpg


VIEW FULL ANALYSIS VISIT - FXOpen Blog...

Disclaimer: This article represents the opinion of the Companies operating under the FXOpen brand only. It is not to be construed as an offer, solicitation, or recommendation with respect to products and services provided by the Companies operating under the FXOpen brand, nor is it to be considered financial advice.
 
EUR/USD Starts Recovery, USD/CHF Dips Below Support
7GuCrBT.jpg


EUR/USD started a recovery wave above the 1.0830 resistance. USD/CHF is showing bearish signs below the 0.8830 resistance zone.

Important Takeaways for EUR/USD and USD/CHF Analysis Today

  • The Euro gained pace after it broke the 1.0830 resistance against the US Dollar.
  • There was a break above a key bearish trend line with resistance near 1.0800 on the hourly chart of EUR/USD at FXOpen.
  • USD/CHF is consolidating losses below the 0.8810 resistance.
  • There was a break below a contracting triangle with support near 0.8830 on the hourly chart at FXOpen.

EUR/USD Technical Analysis

On the hourly chart of EUR/USD at FXOpen, the pair started a recovery wave from the 1.0770 level. The Euro even cleared the 1.0800 barrier to move into a bullish zone against the US Dollar.

Besides, there was a break above a key bearish trend line with resistance near 1.0800. It opened the doors for a move above the 50-hour simple moving average and 1.0830. Finally, the pair tested the 1.0880 resistance.

E1BRQ3E.jpg


VIEW FULL ANALYSIS VISIT - FXOpen Blog...

Disclaimer: This article represents the opinion of the Companies operating under the FXOpen brand only. It is not to be construed as an offer, solicitation, or recommendation with respect to products and services provided by the Companies operating under the FXOpen brand, nor is it to be considered financial advice.
 
FTSE 100 Goes on Massive Rebound! Marks & Spencer's Resurgence Sparks Optimism
0cyDxee.jpg


The FTSE 100 index, a prominent benchmark of the UK stock market, has witnessed a remarkable turnaround in recent days. After a month-long decline that saw the index drop from 7,700 points on July 31 to as low as 7,262 points by mid-August, a sudden shift has propelled it to its highest point in five days, exceeding 7,503 points. This article employs technical analysis to dissect the factors contributing to this rebound and highlights the potential impact of Marks & Spencer's resurgence on the FTSE 100's performance.

VIEW FULL ANALYSIS VISIT - FXOpen Blog...

Disclaimer: This article represents the opinion of the Companies operating under the FXOpen brand only. It is not to be construed as an offer, solicitation, or recommendation with respect to products and services provided by the Companies operating under the FXOpen brand, nor is it to be considered financial advice.
 
Back
Top