Admiral Markets
AdmiralMarkets.com Representative
- Messages
- 95
EURUSD, GBPUSD: bearish price action above critical support
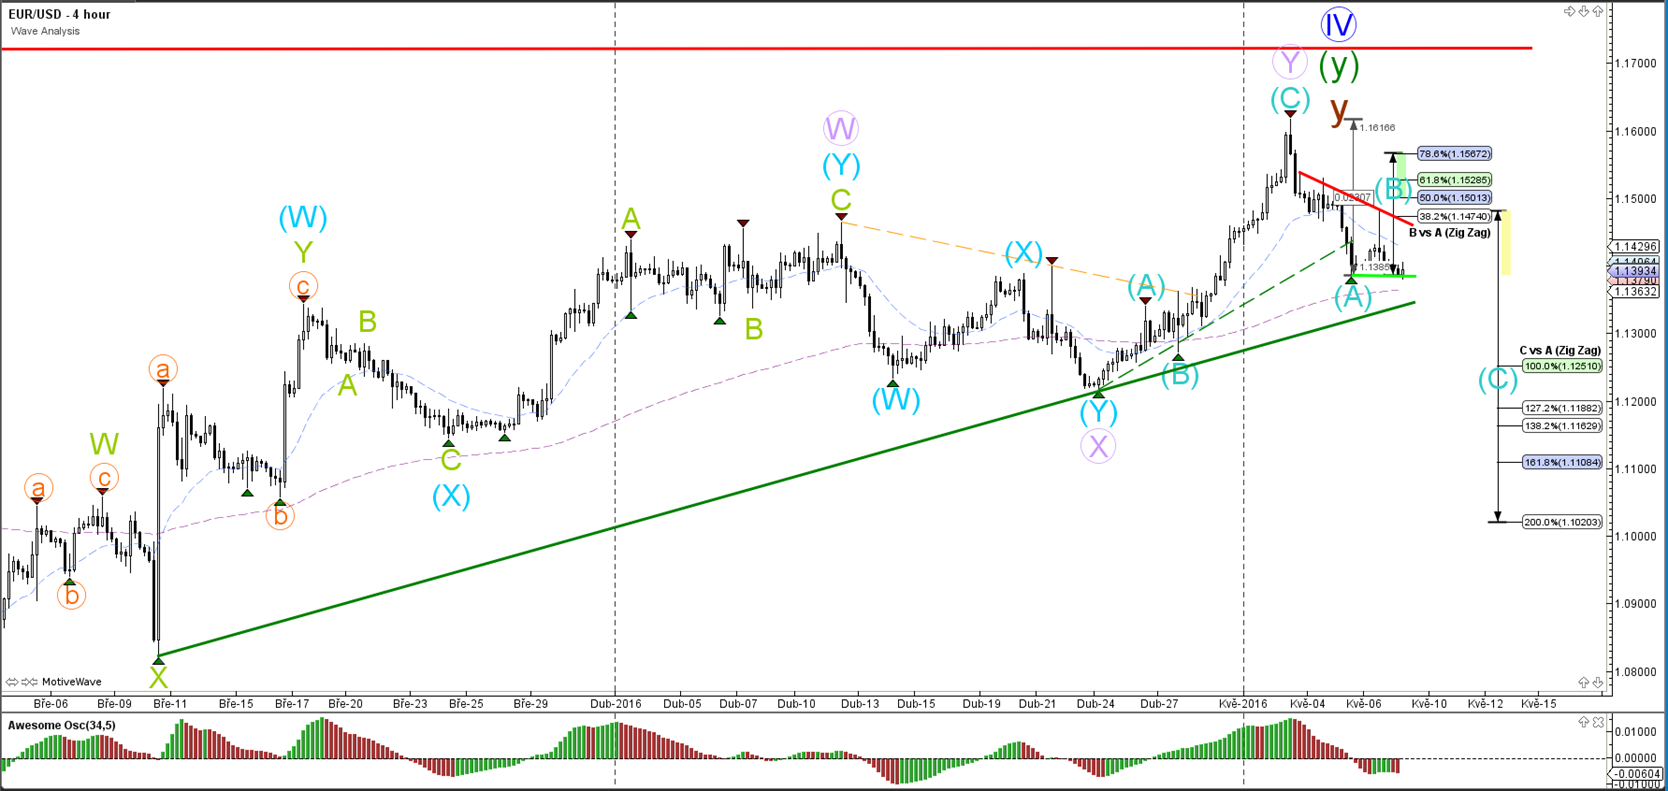
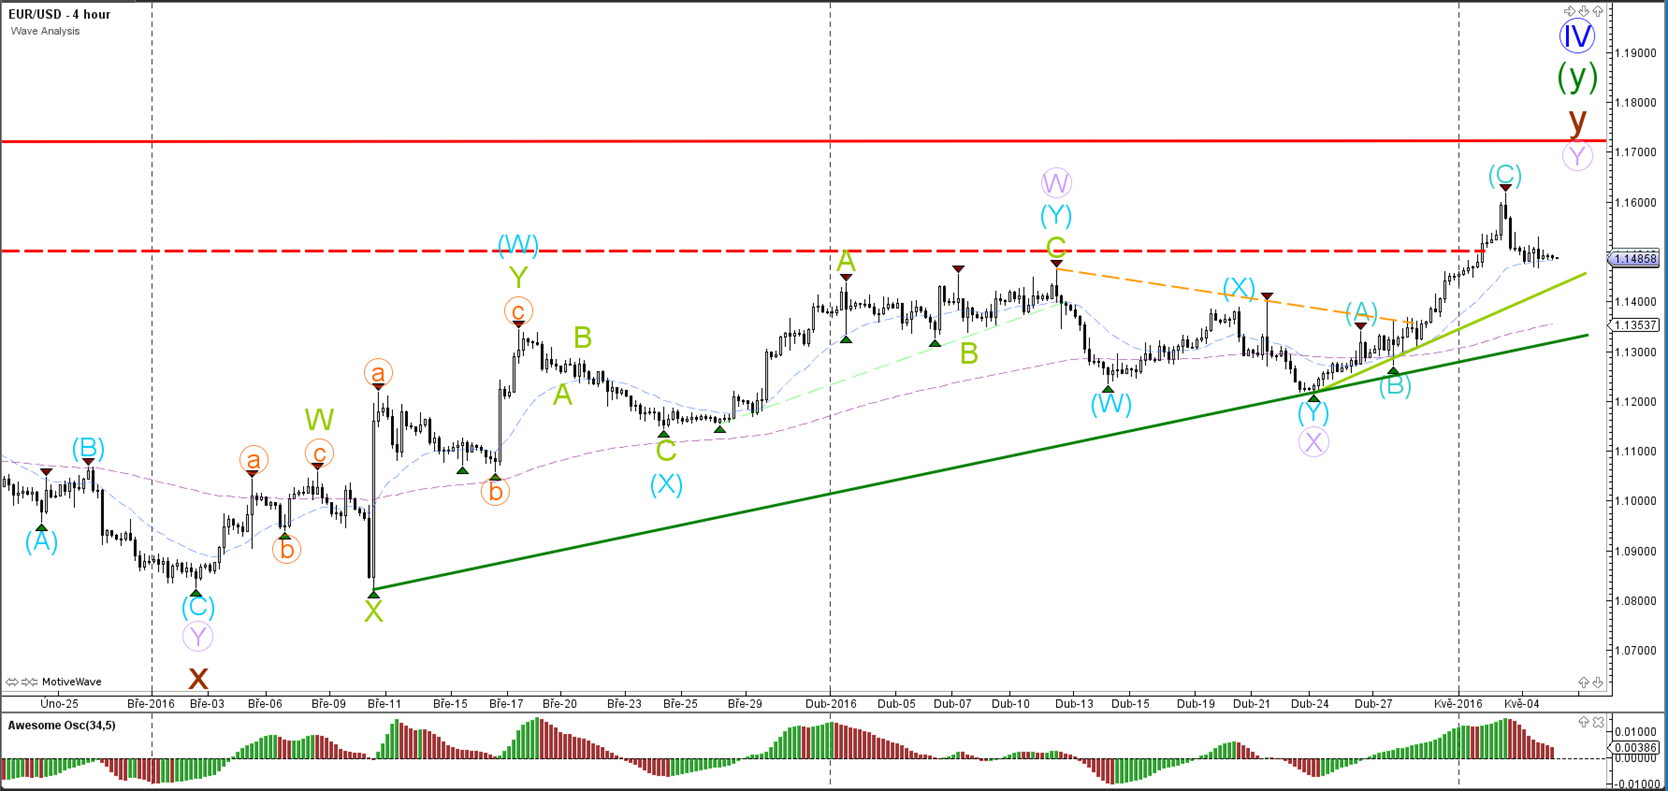
EUR/USD
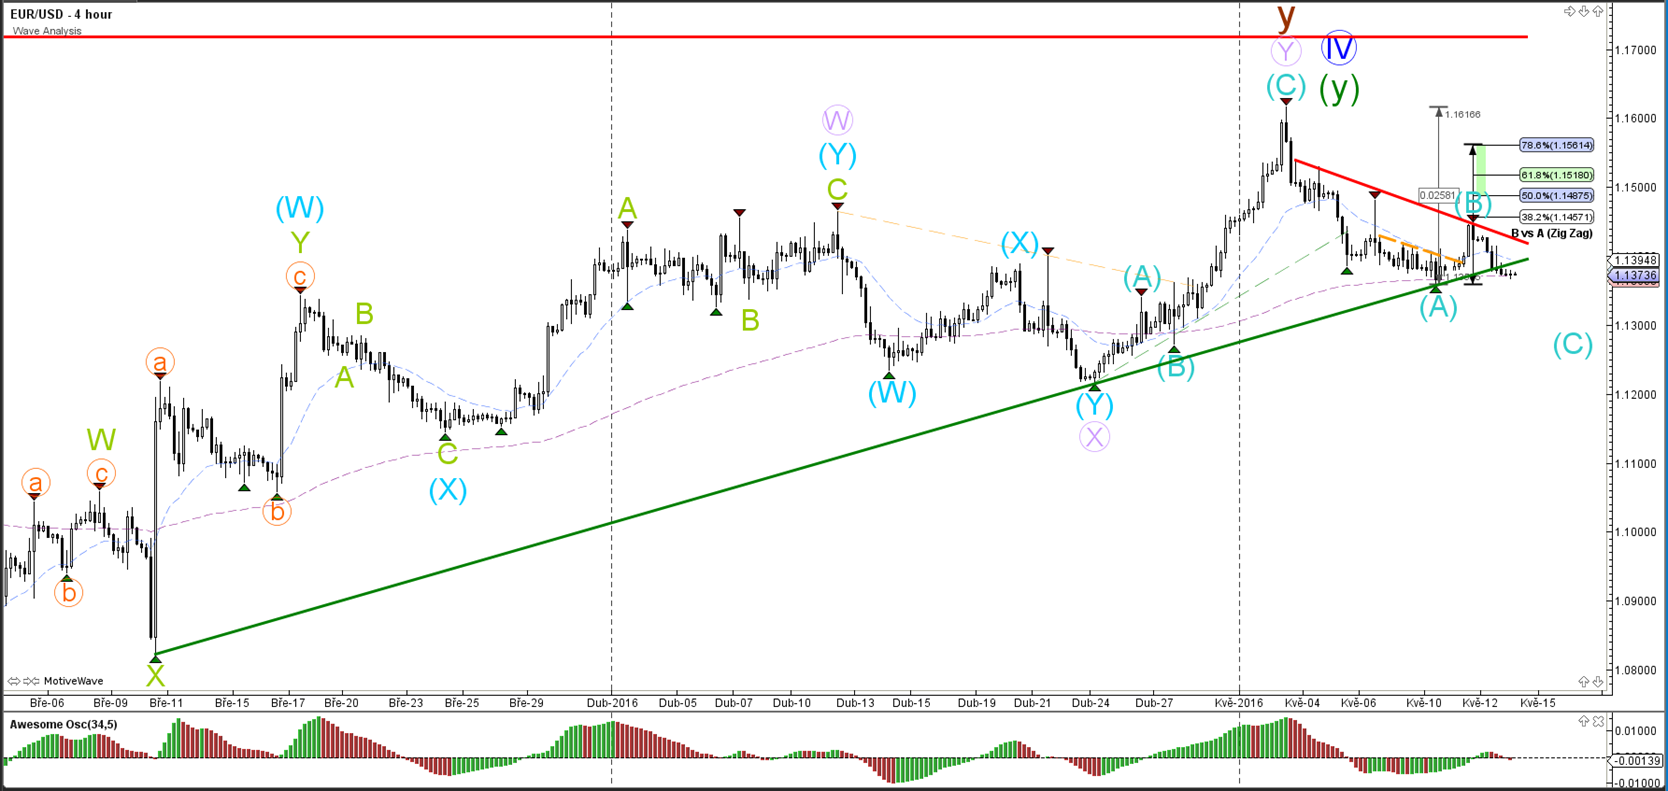
4 hour

The EUR/USD completed the bullish wave C (blue) but the support trend lines (green) need to break before the waves Y of wave 4 (blue) can be considered completed. Until the trend lines break, the current bearish price action could still be a bearish retracement for an uptrend continuation.
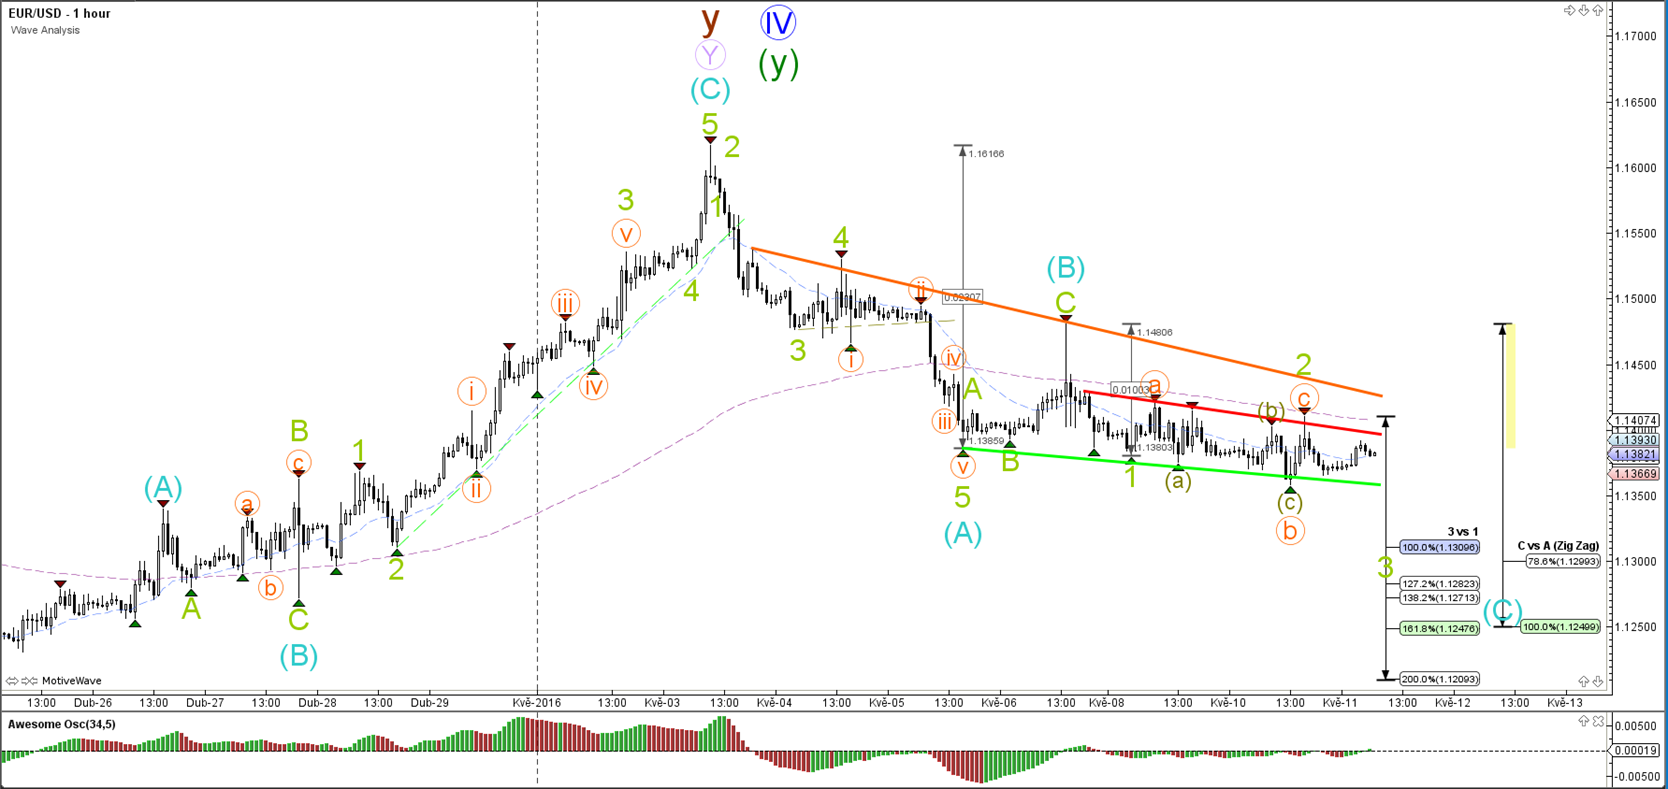
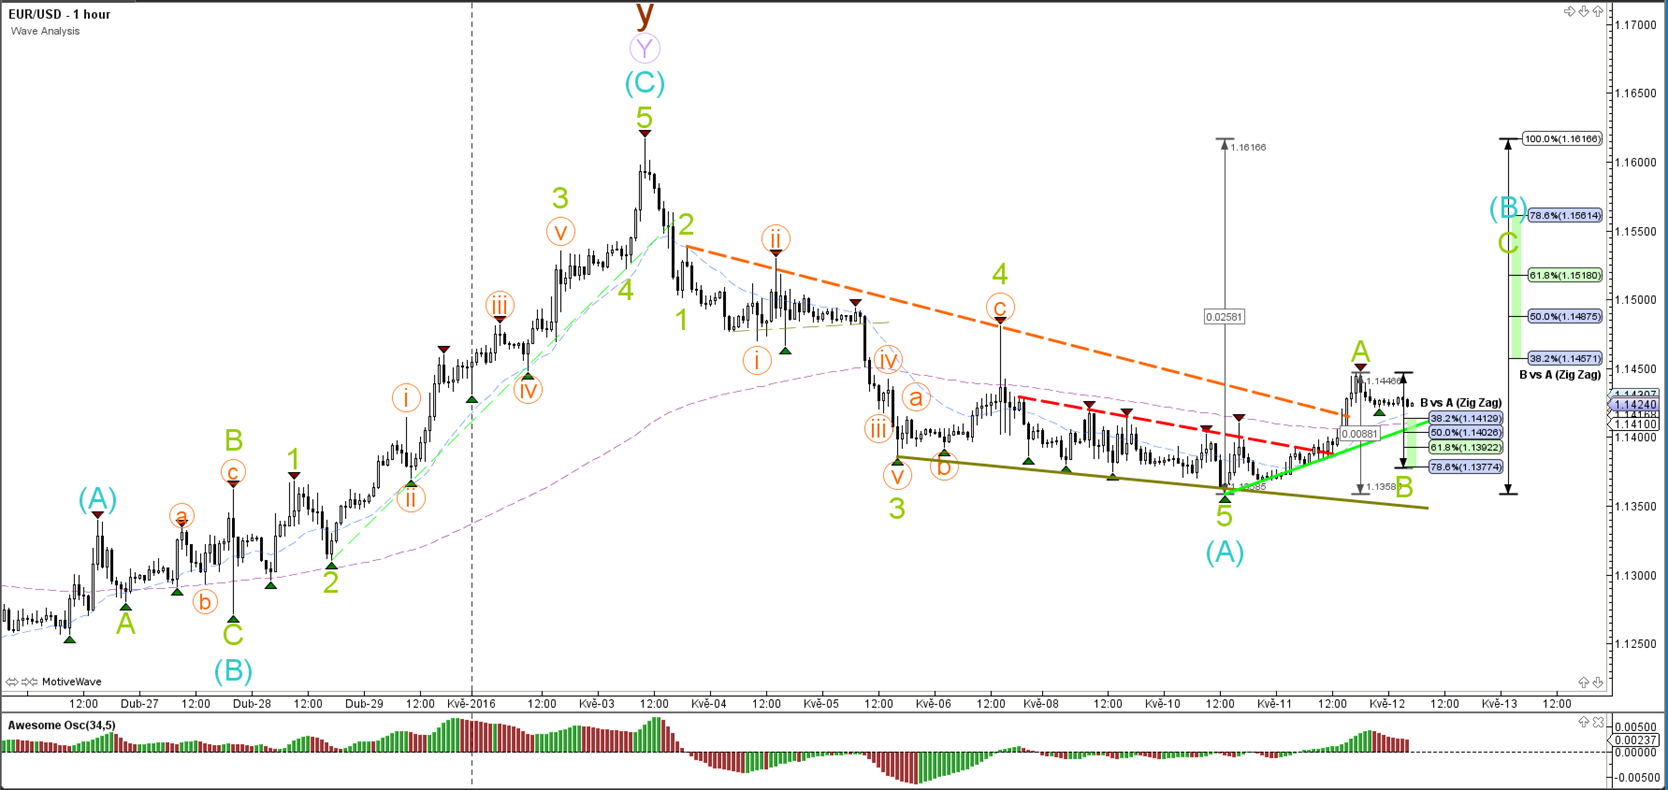
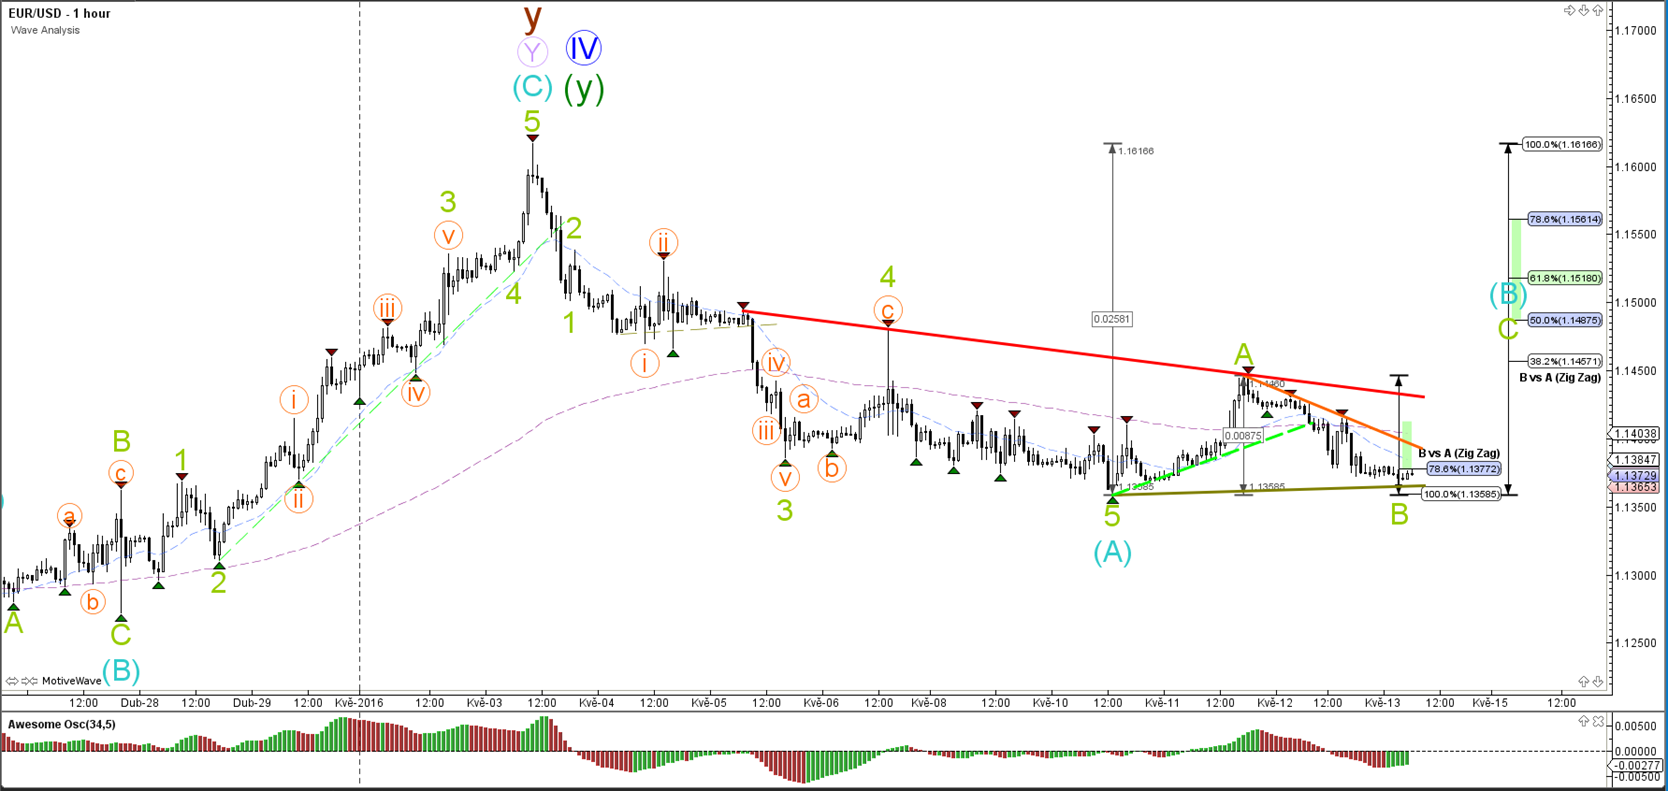
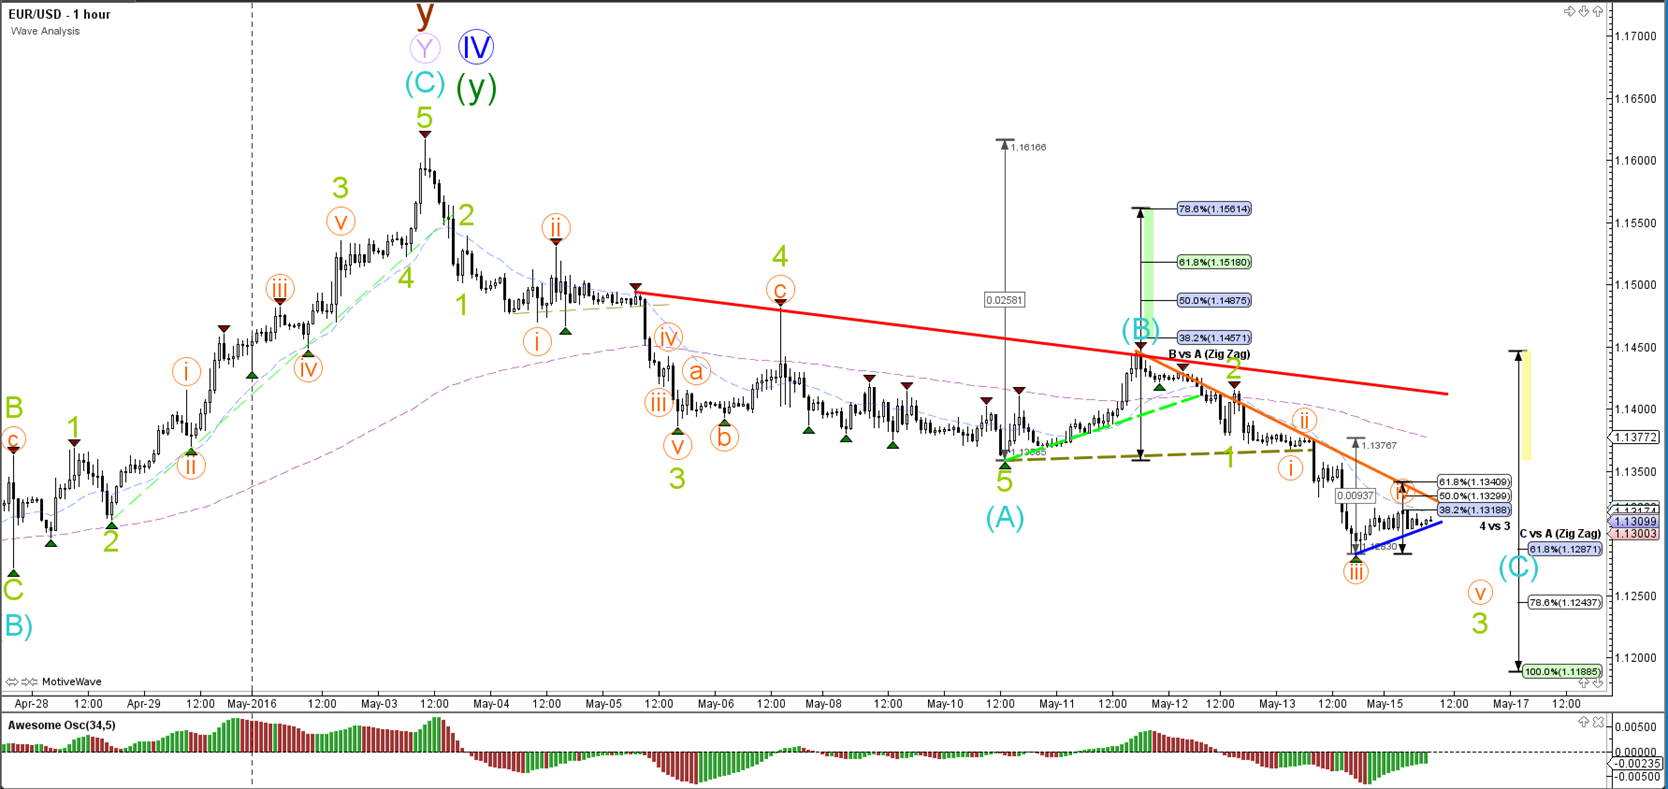
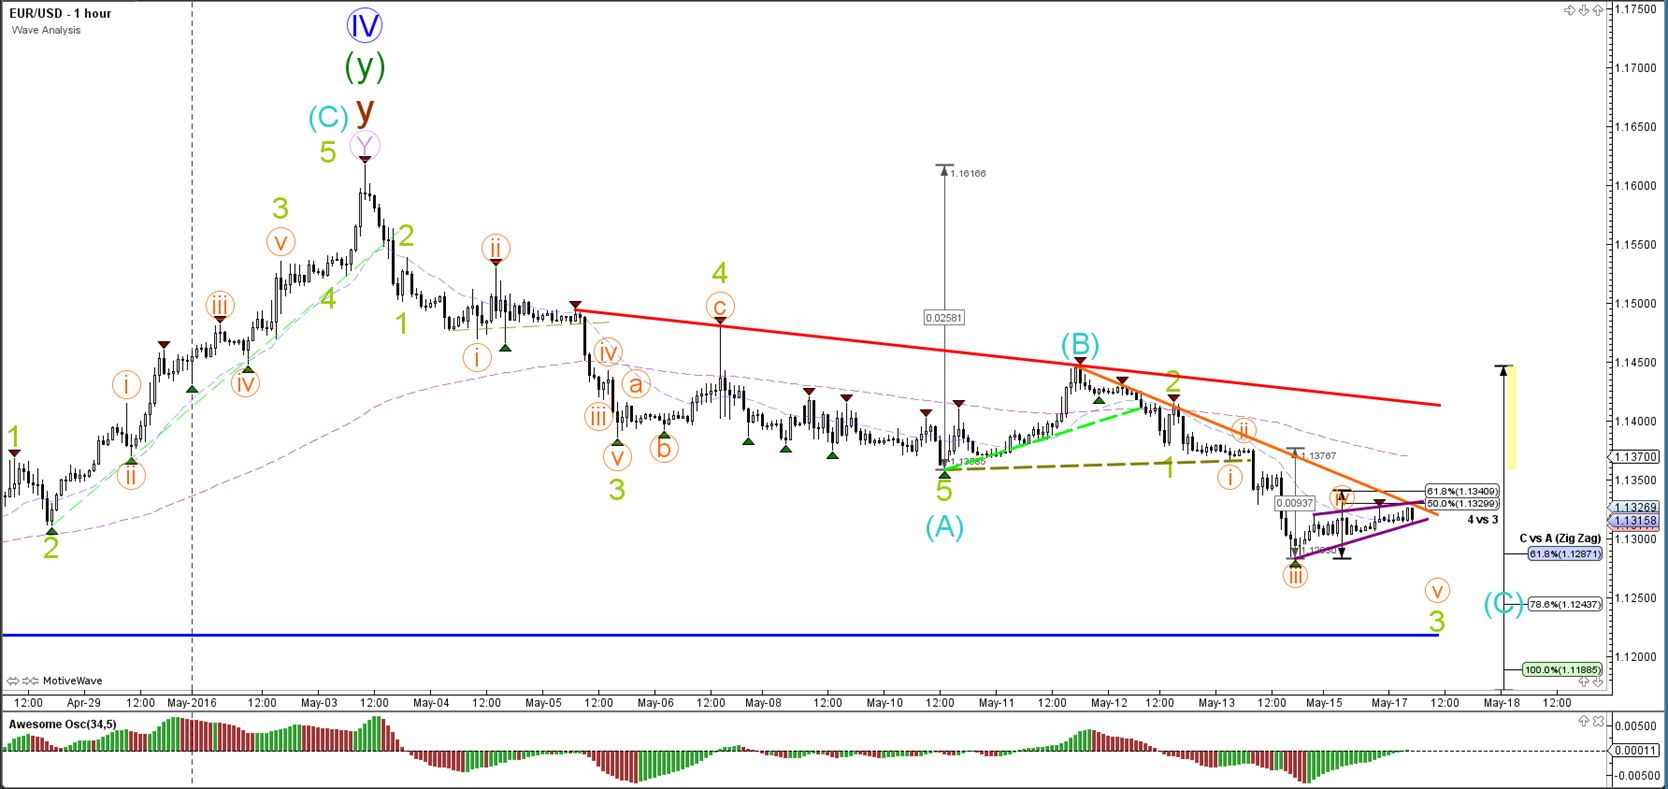
1 hour

The EUR/USD seems to have completed a bearish wave 5 (blue) of wave A (purple). For the moment a bearish ABC zigzag (purple) seems the most logical path of least resistance for price. The wave count could turn into a 123 if price breaks below support.
GBP/USD
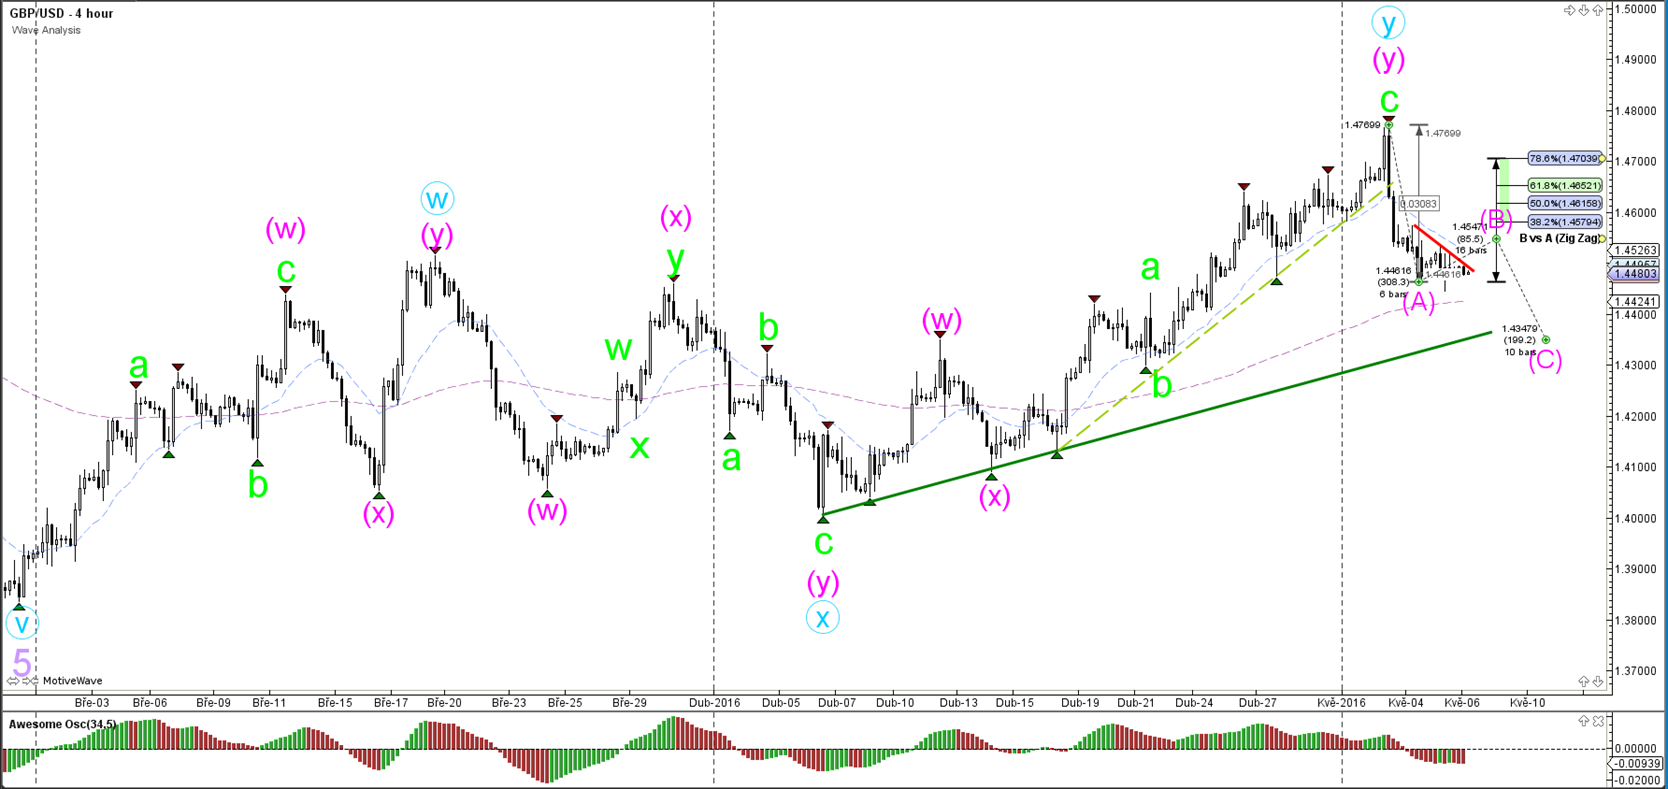
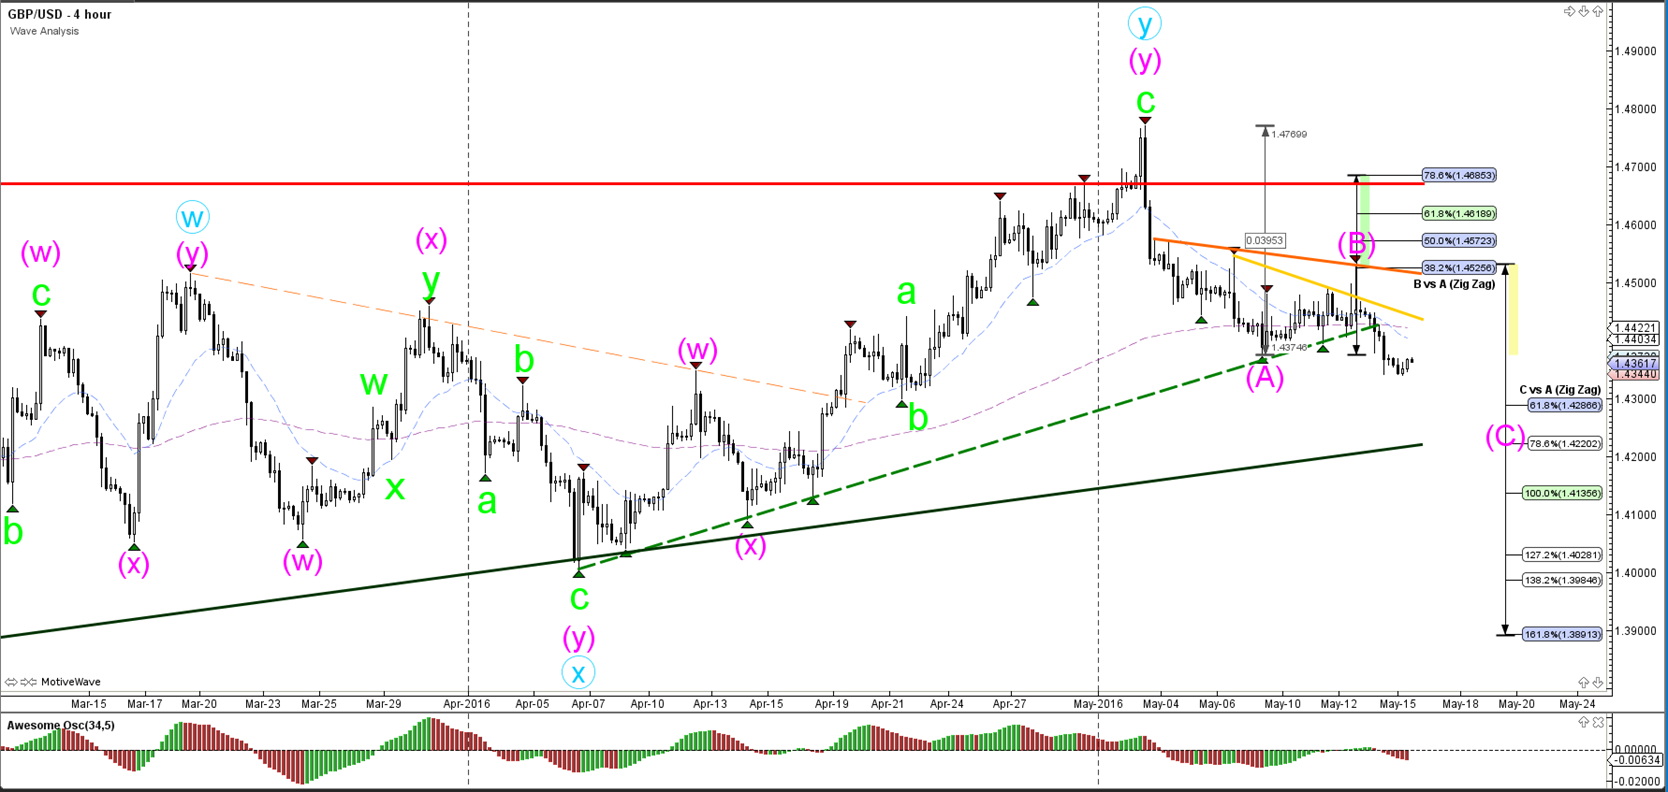
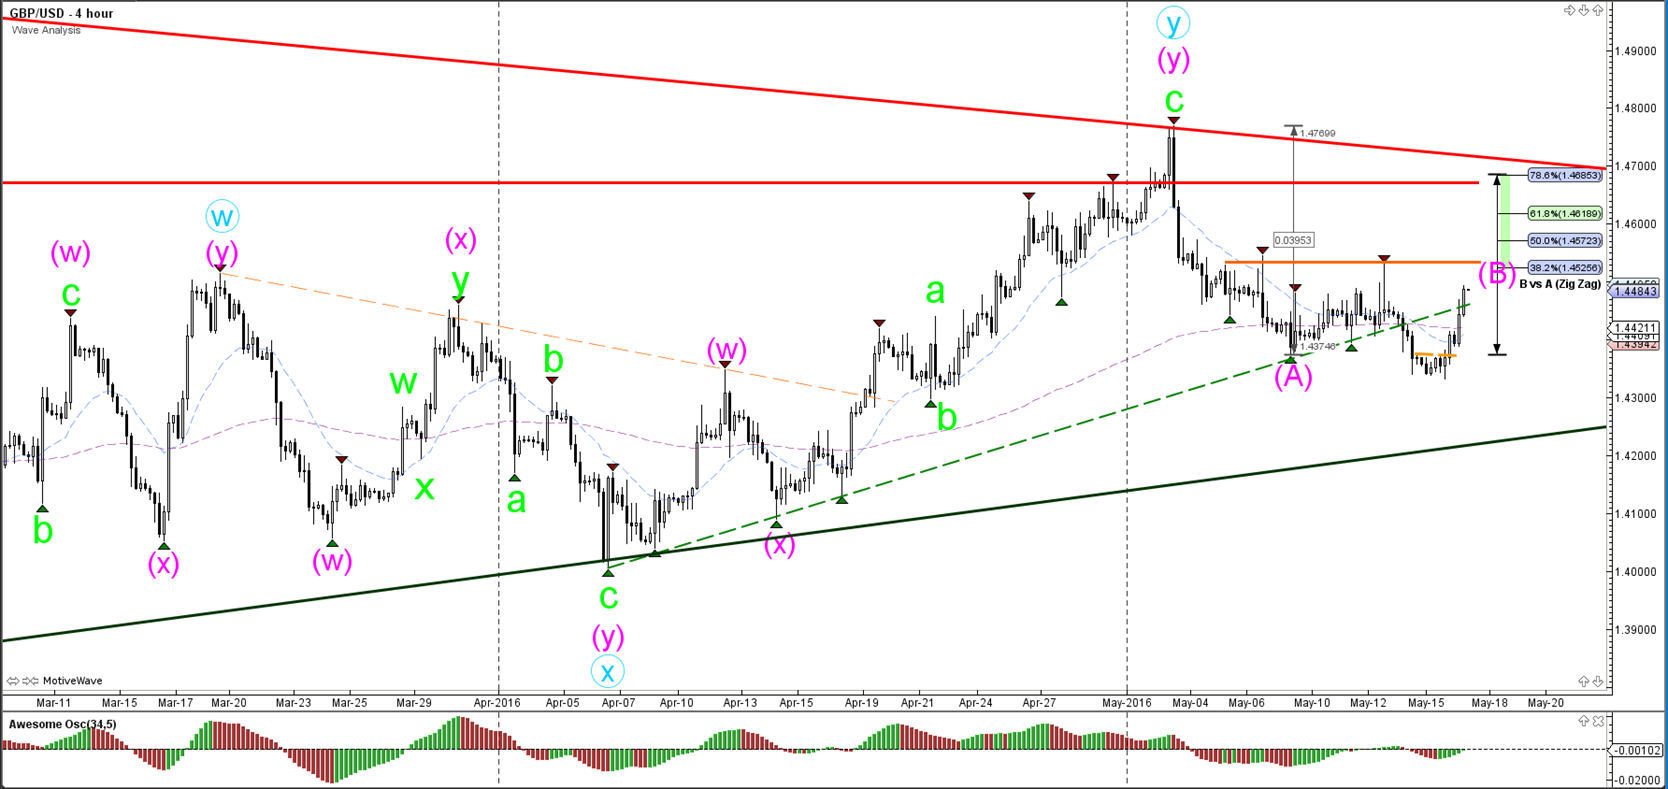
4 hour

The GBP/USD broke the inner support trend line (dotted green) but has an outer and shallower support trend line remaining (solid green). A break of that support trend line would confirm the downtrend on the GBP/USD whereas a bounce at support could indicate an expansion of the uptrend.
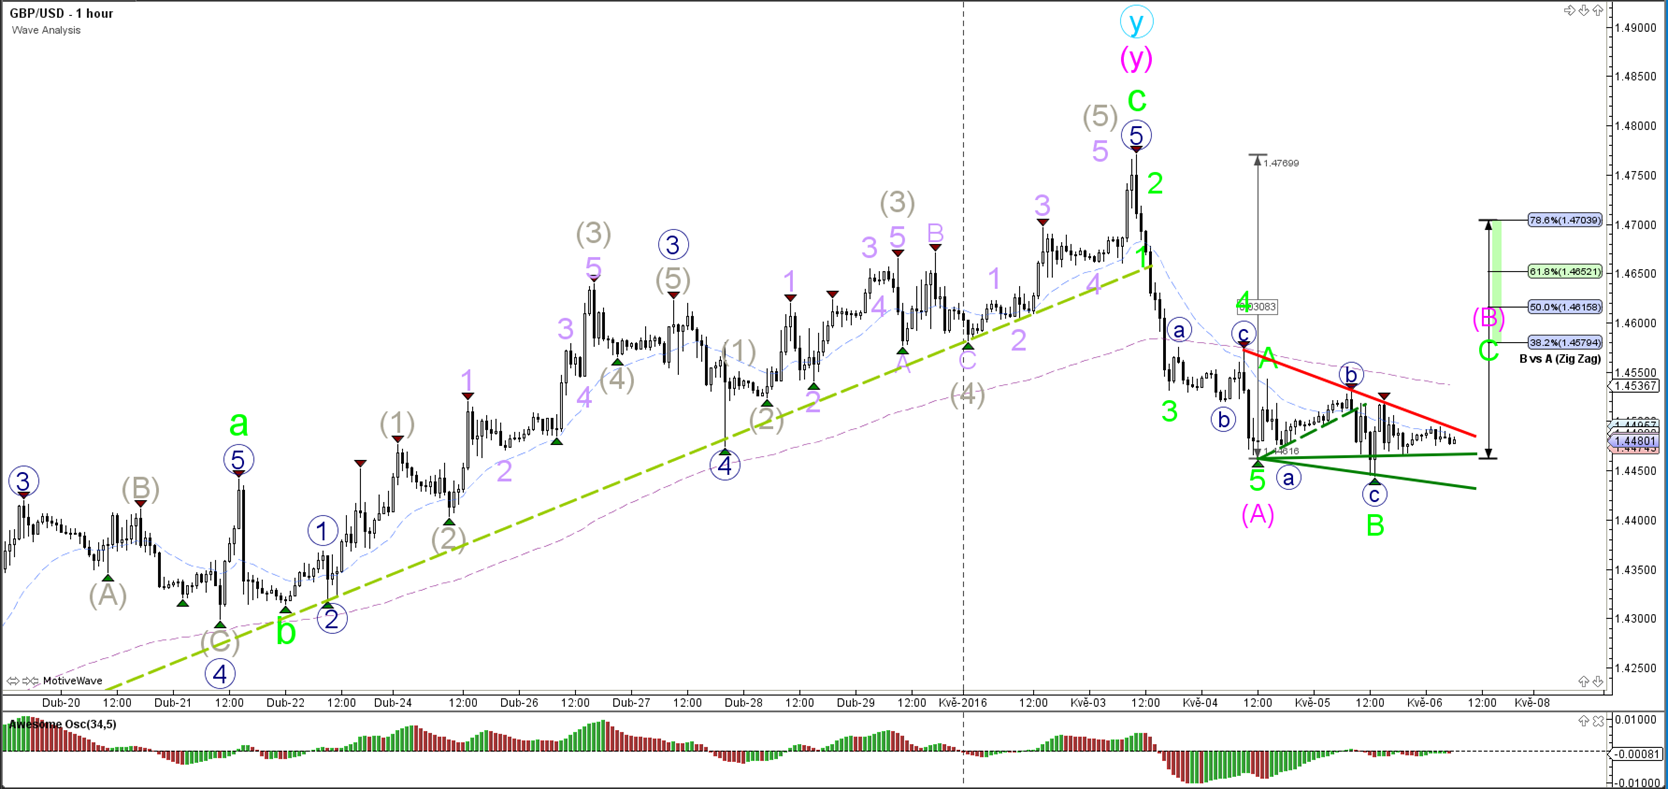
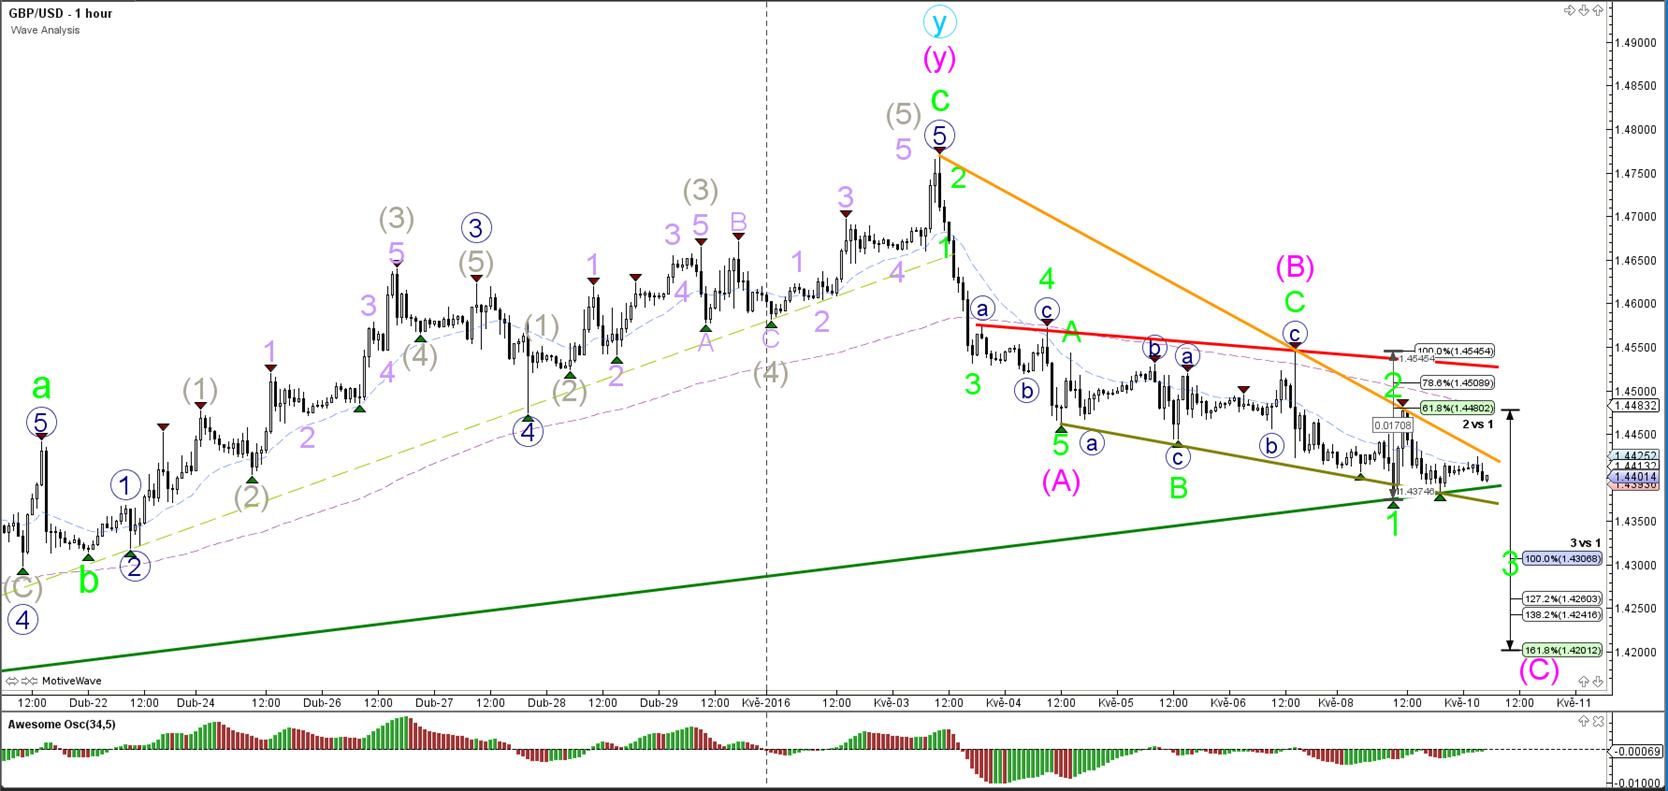
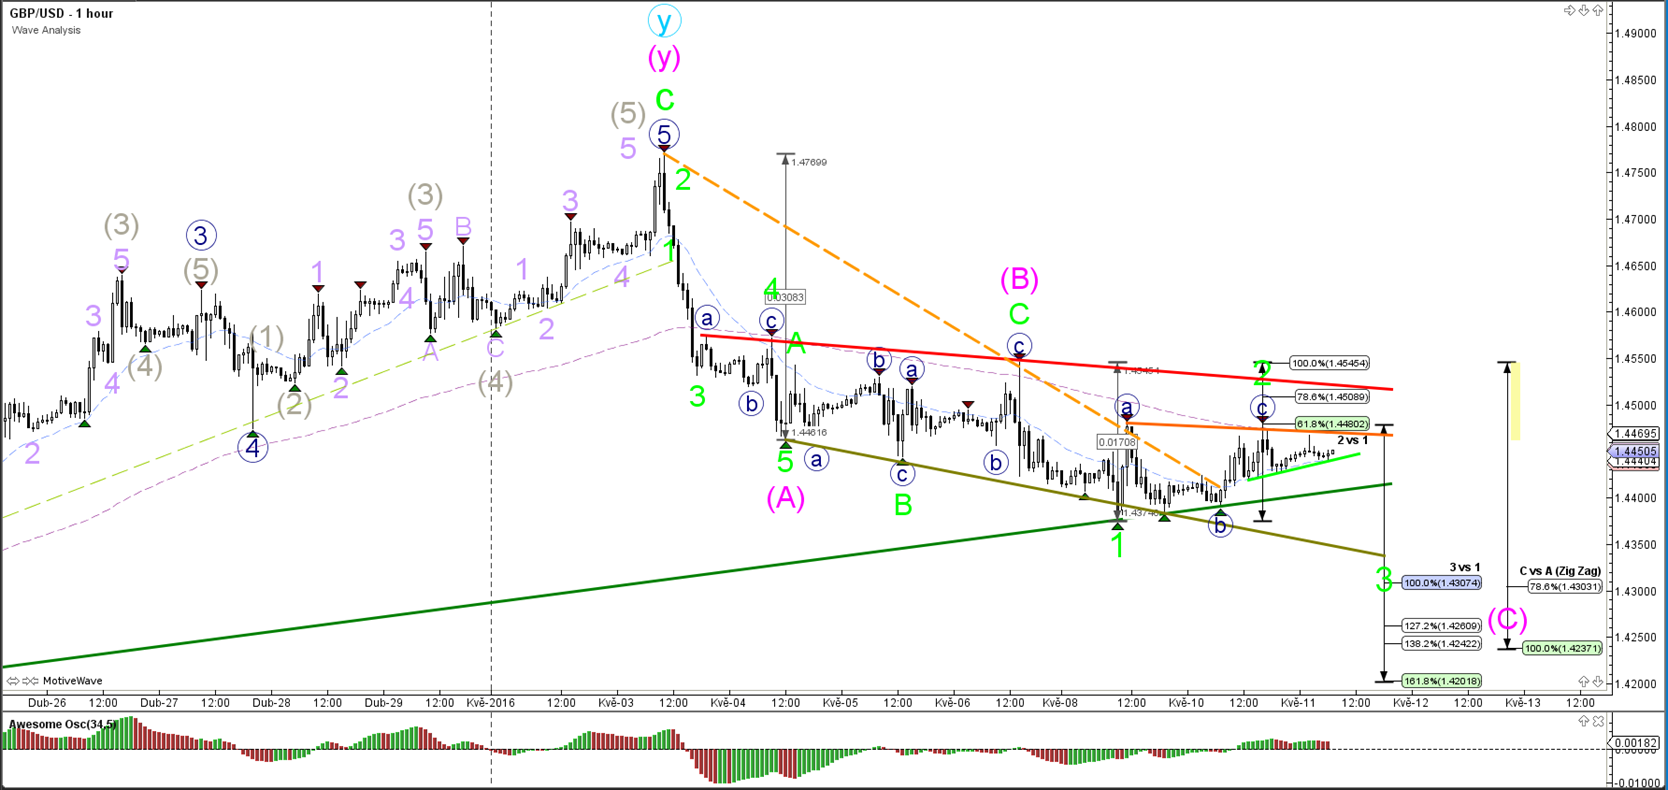
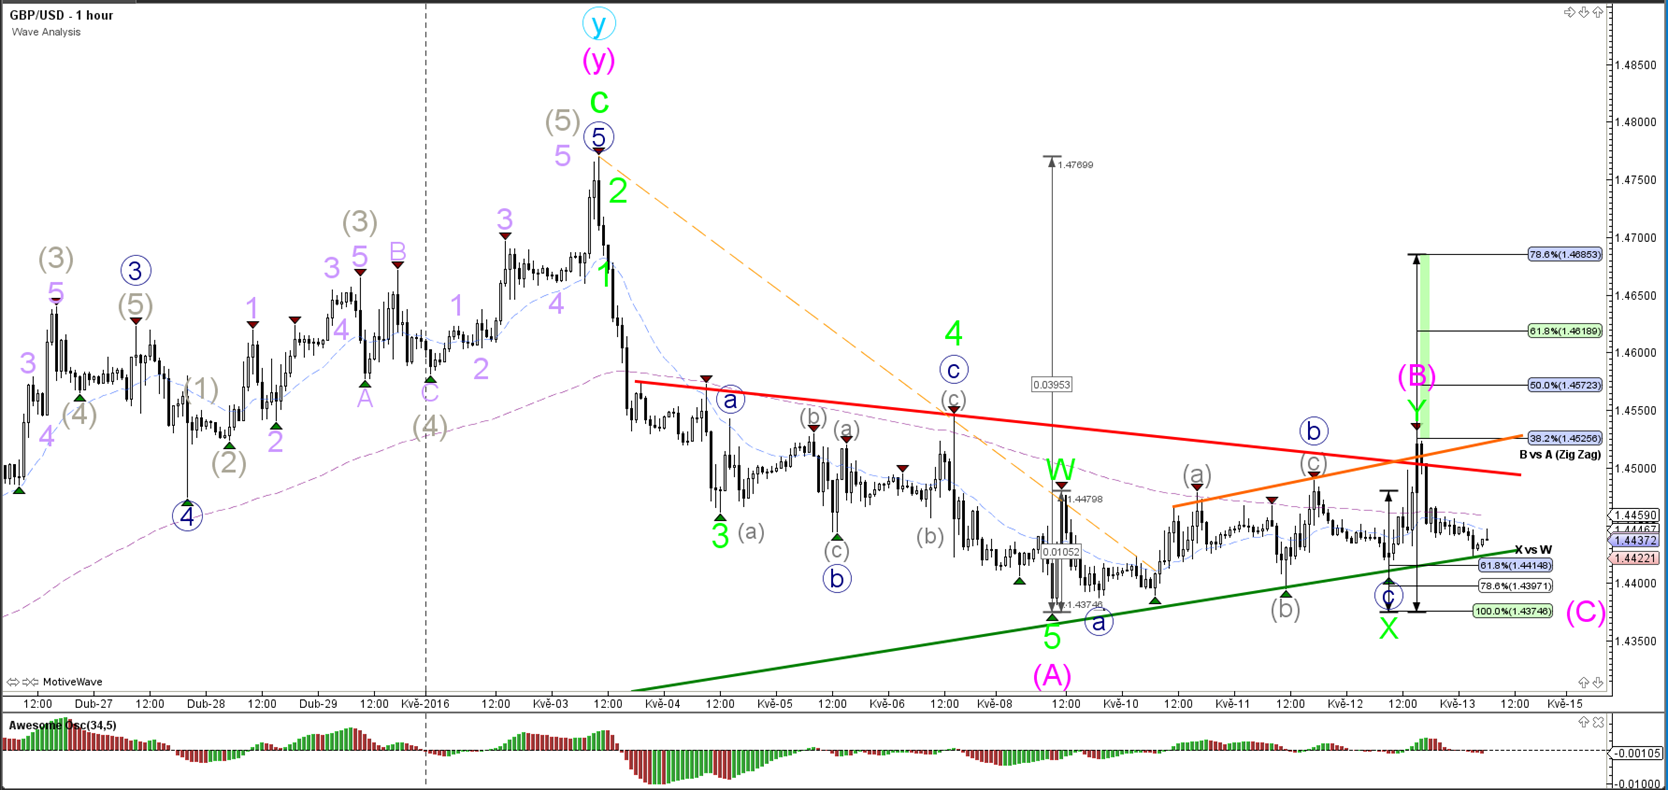
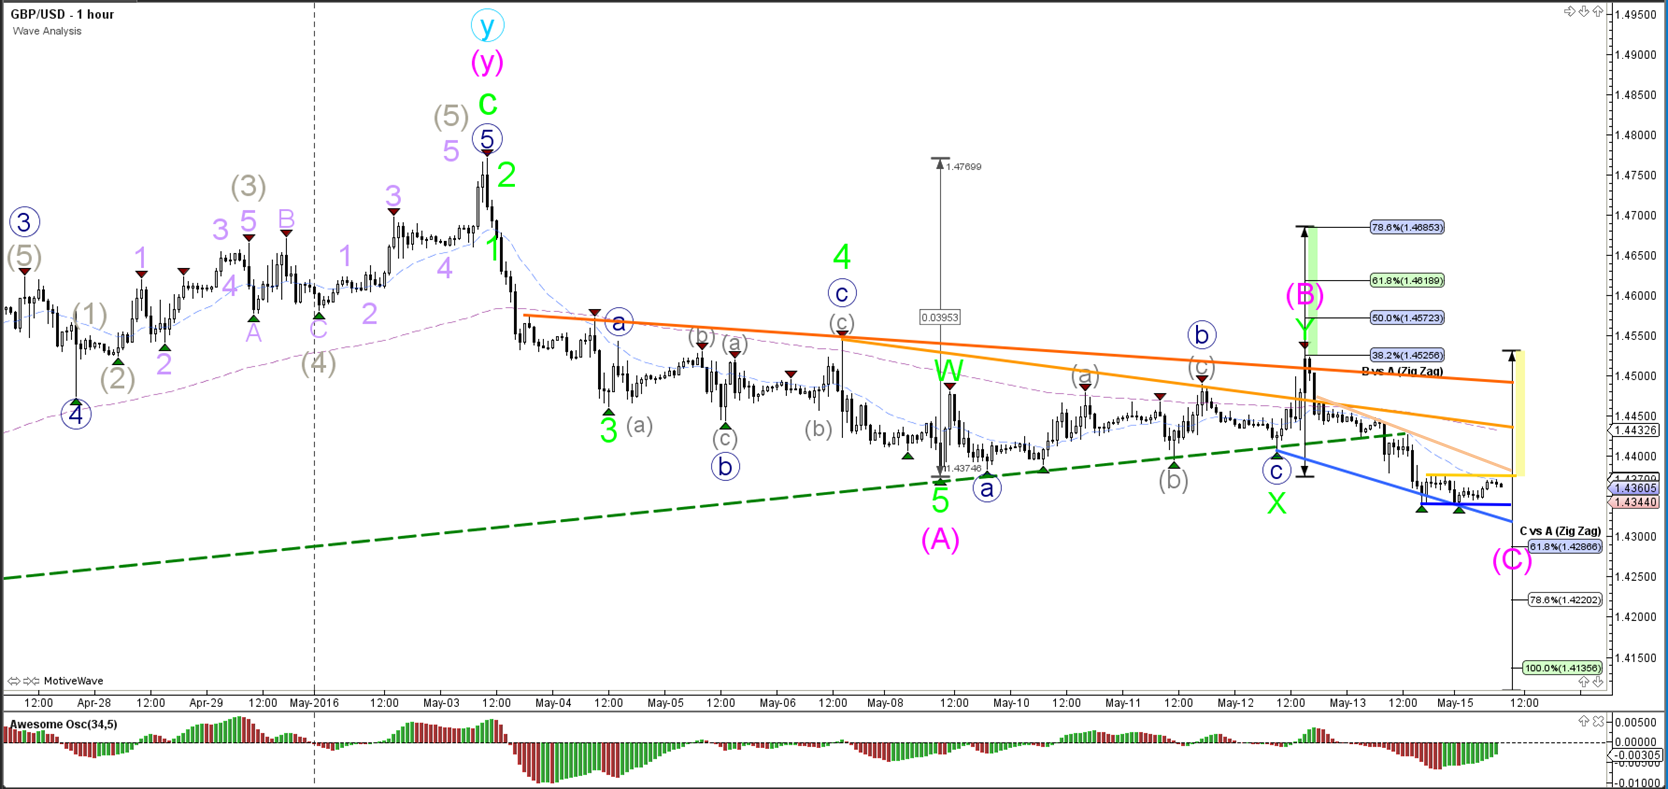
1 hour

The GBP/USD completed a 5th wave (green) within wave A (pink). For the moment a wave B (pink) correction seems the most likely scenario unless price break below the channel.
USD/JPY
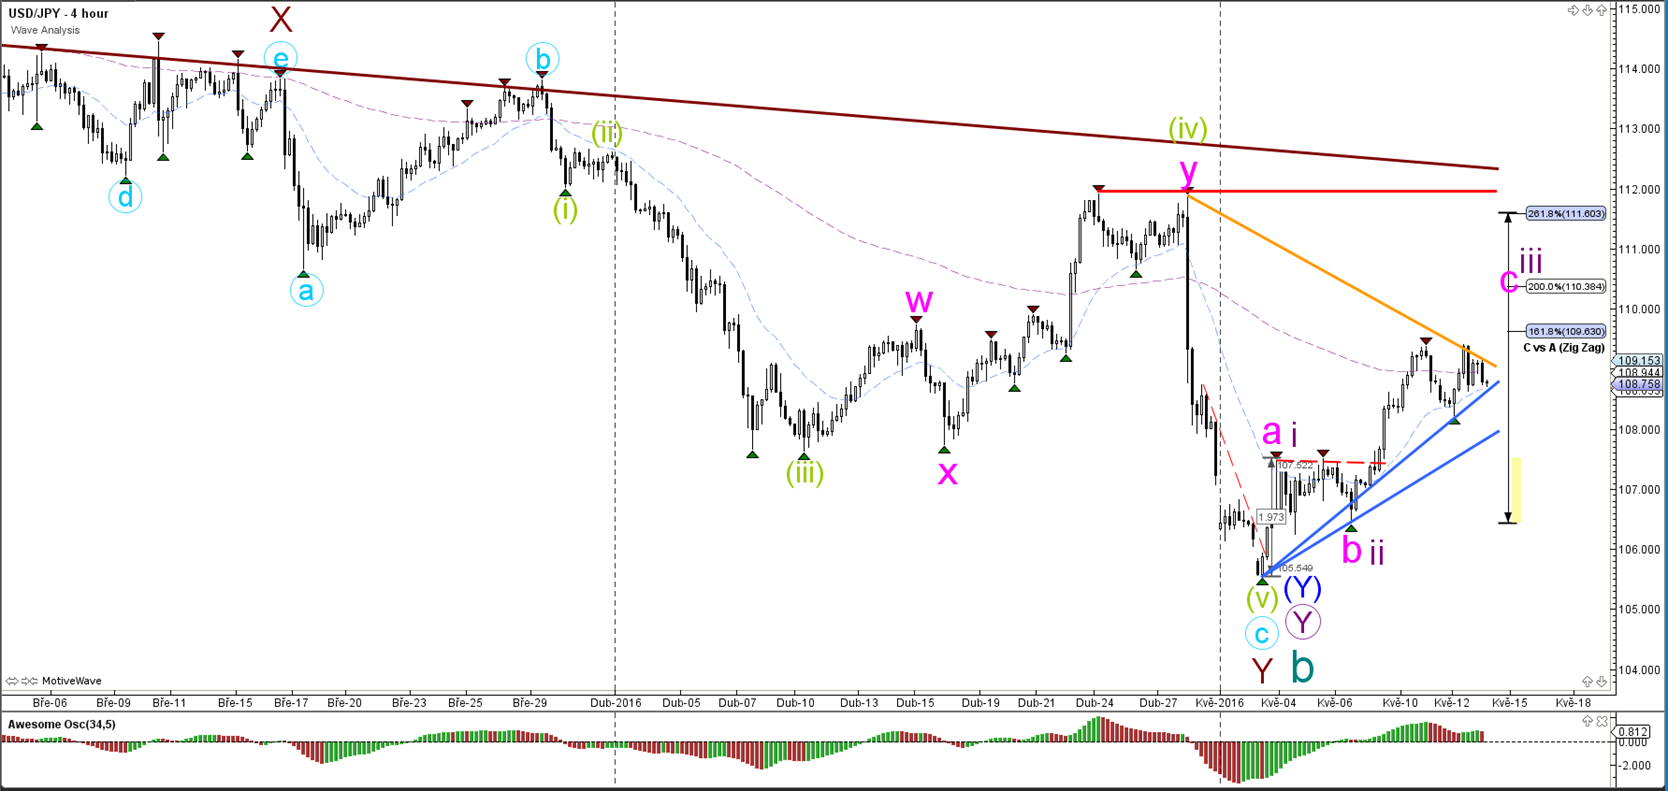
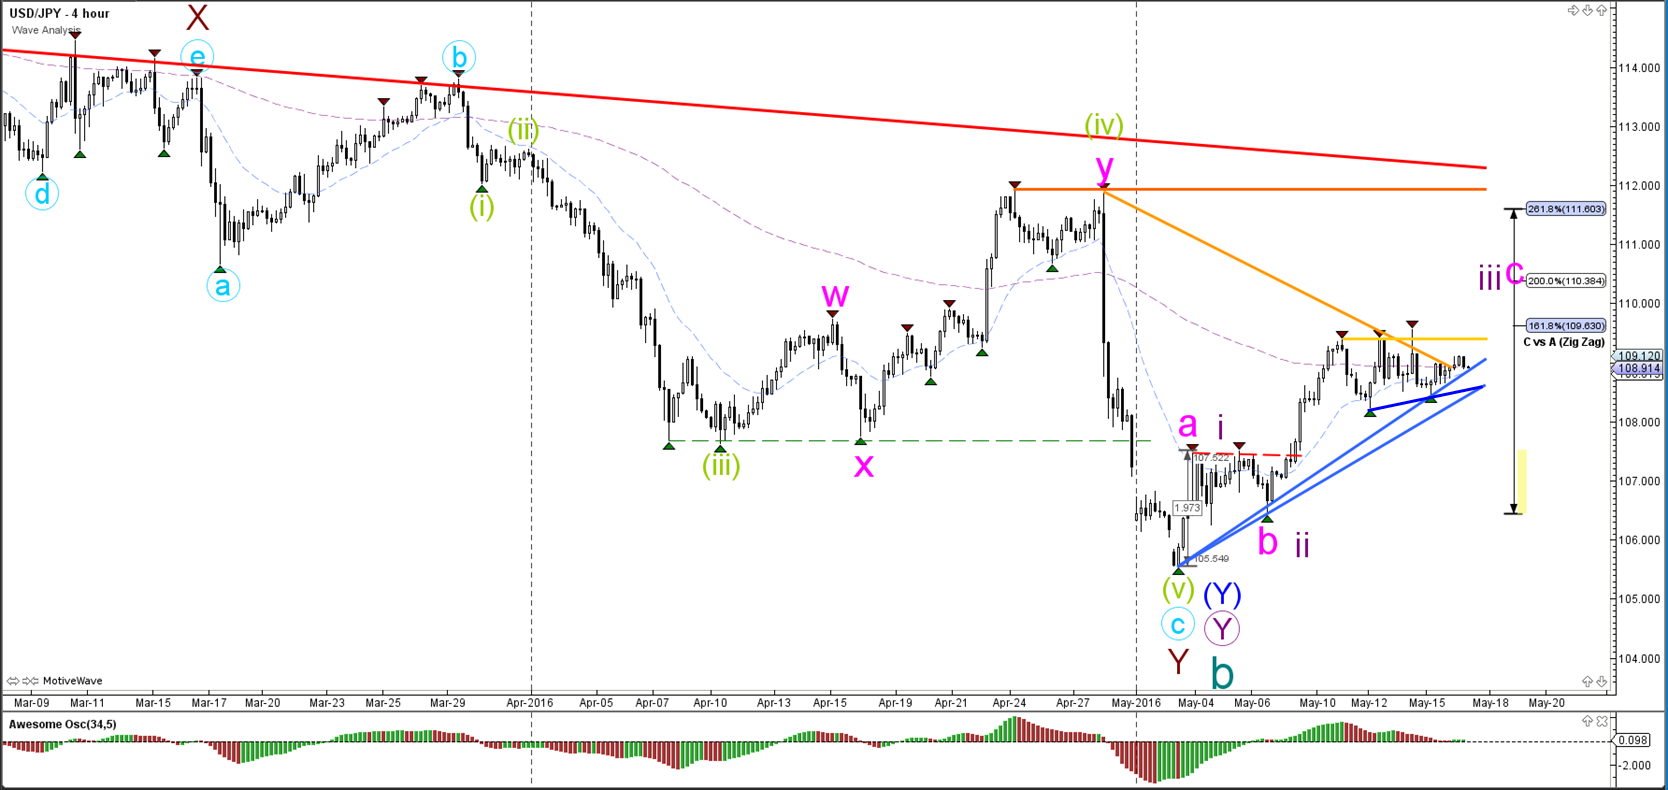
4 hour

The USD/JPY is showing a strong bullish bounce after breaking a resistance trend line (dotted red). The bullish price action could be a first signal that the US Dollar can make a decent rally.
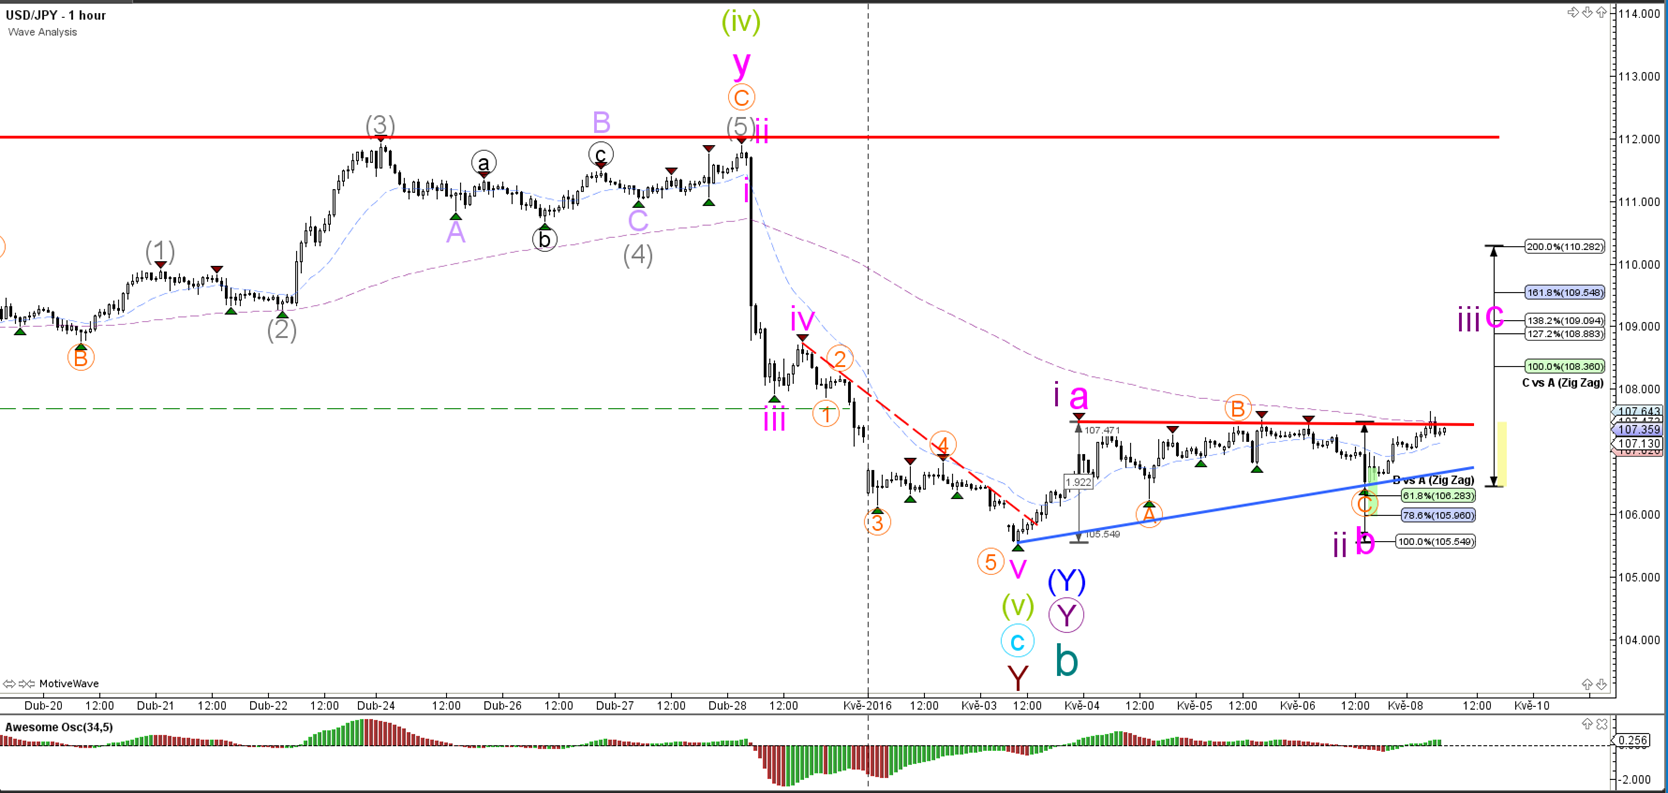
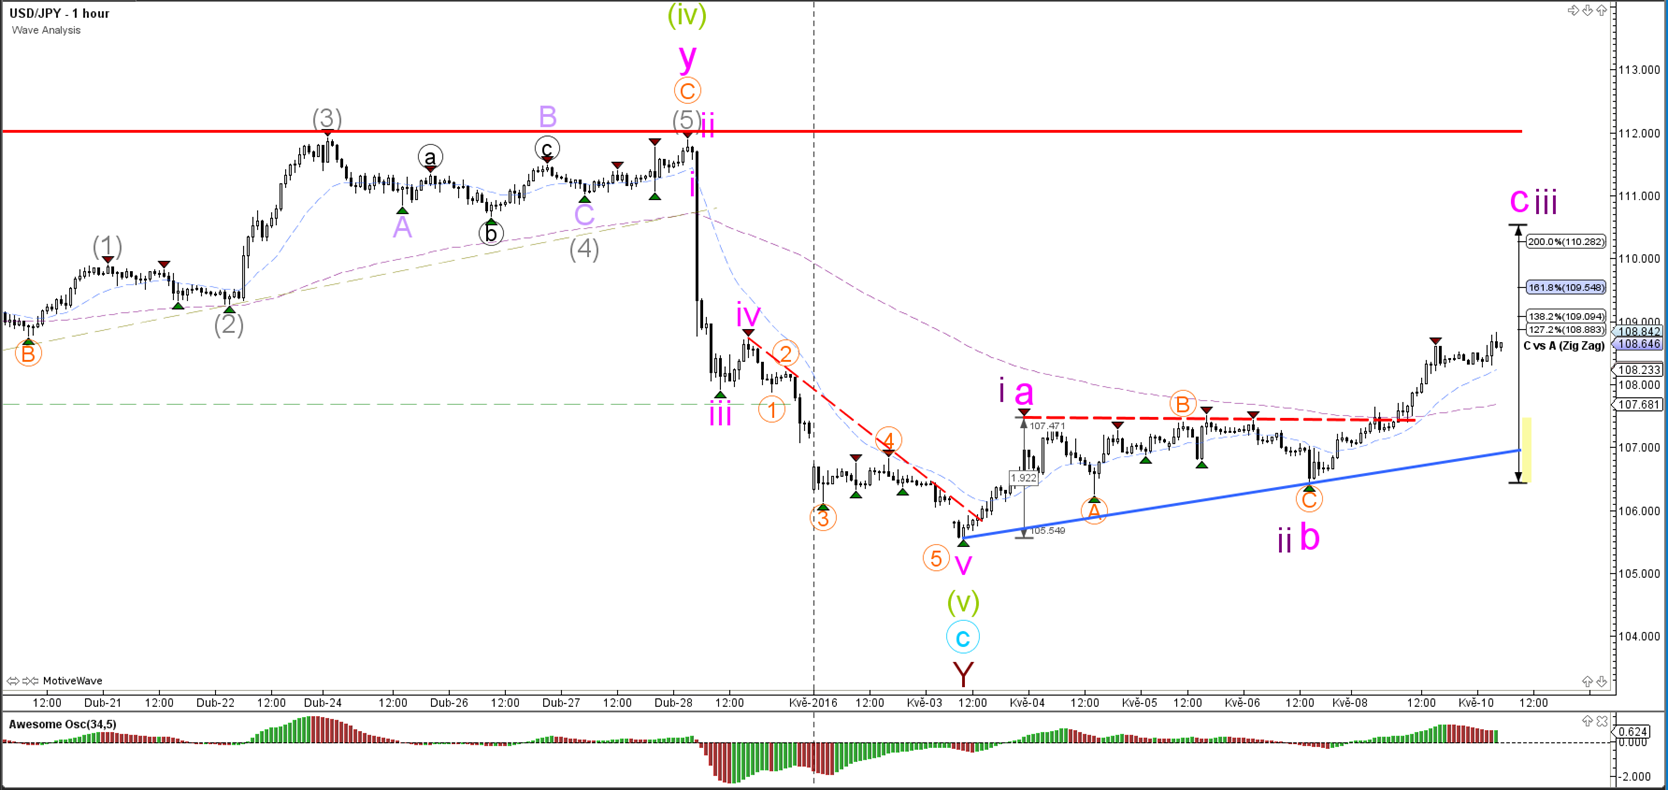
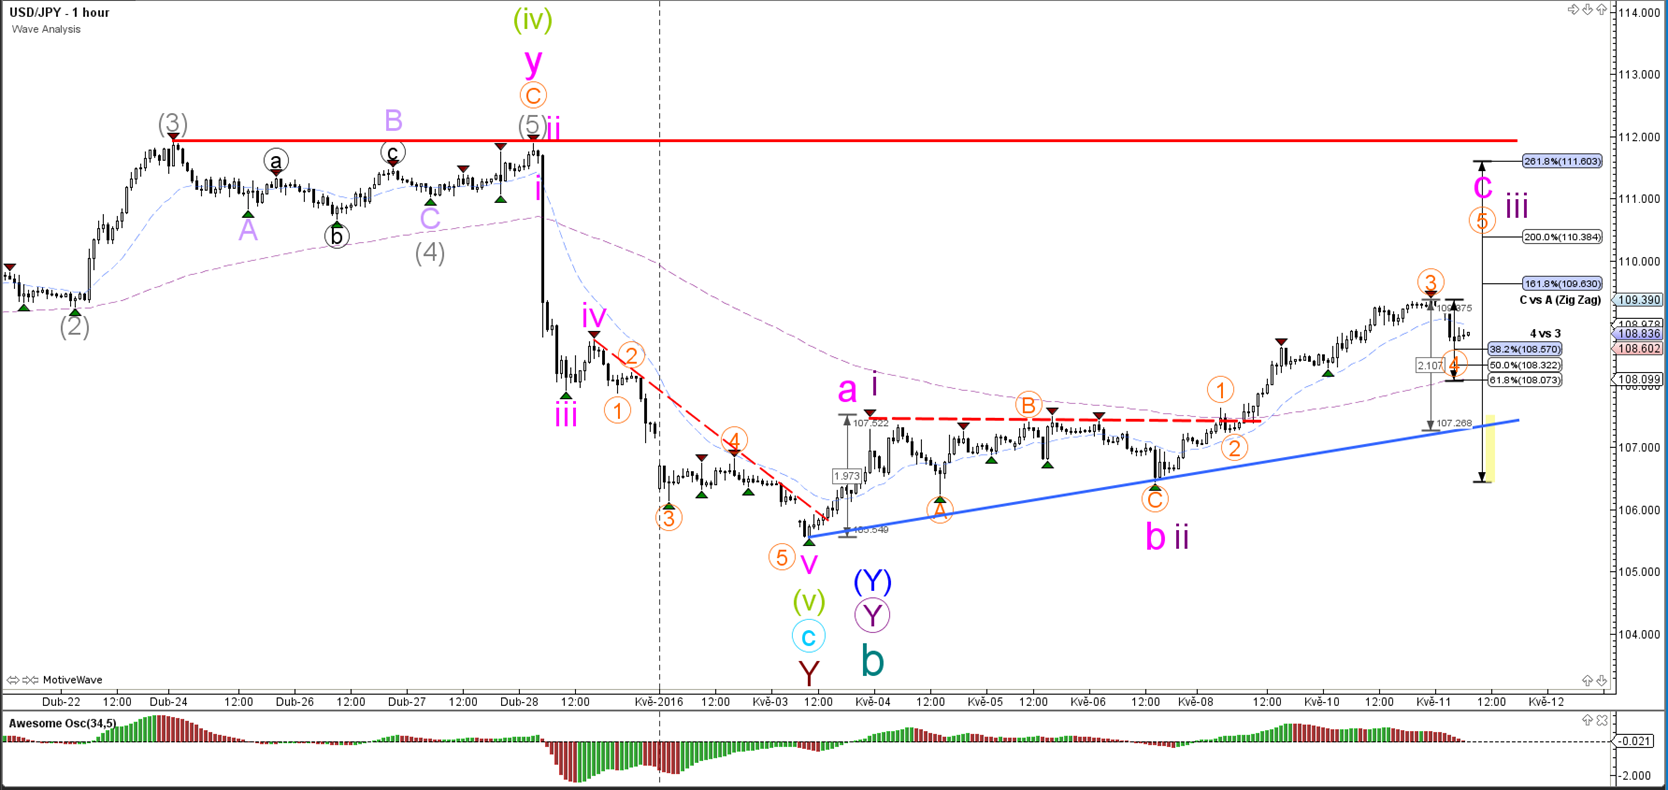
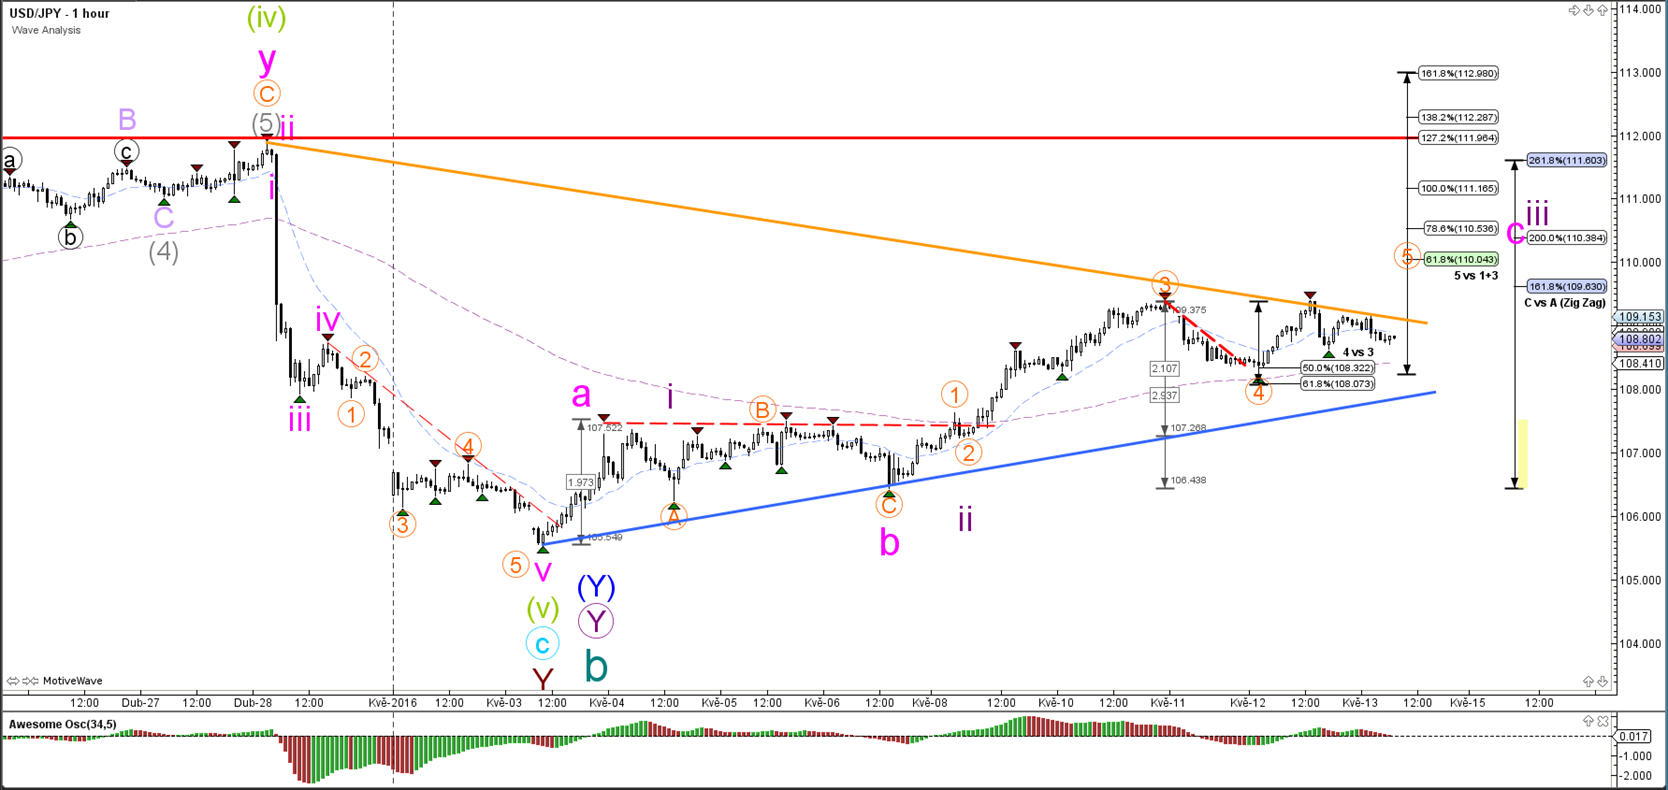
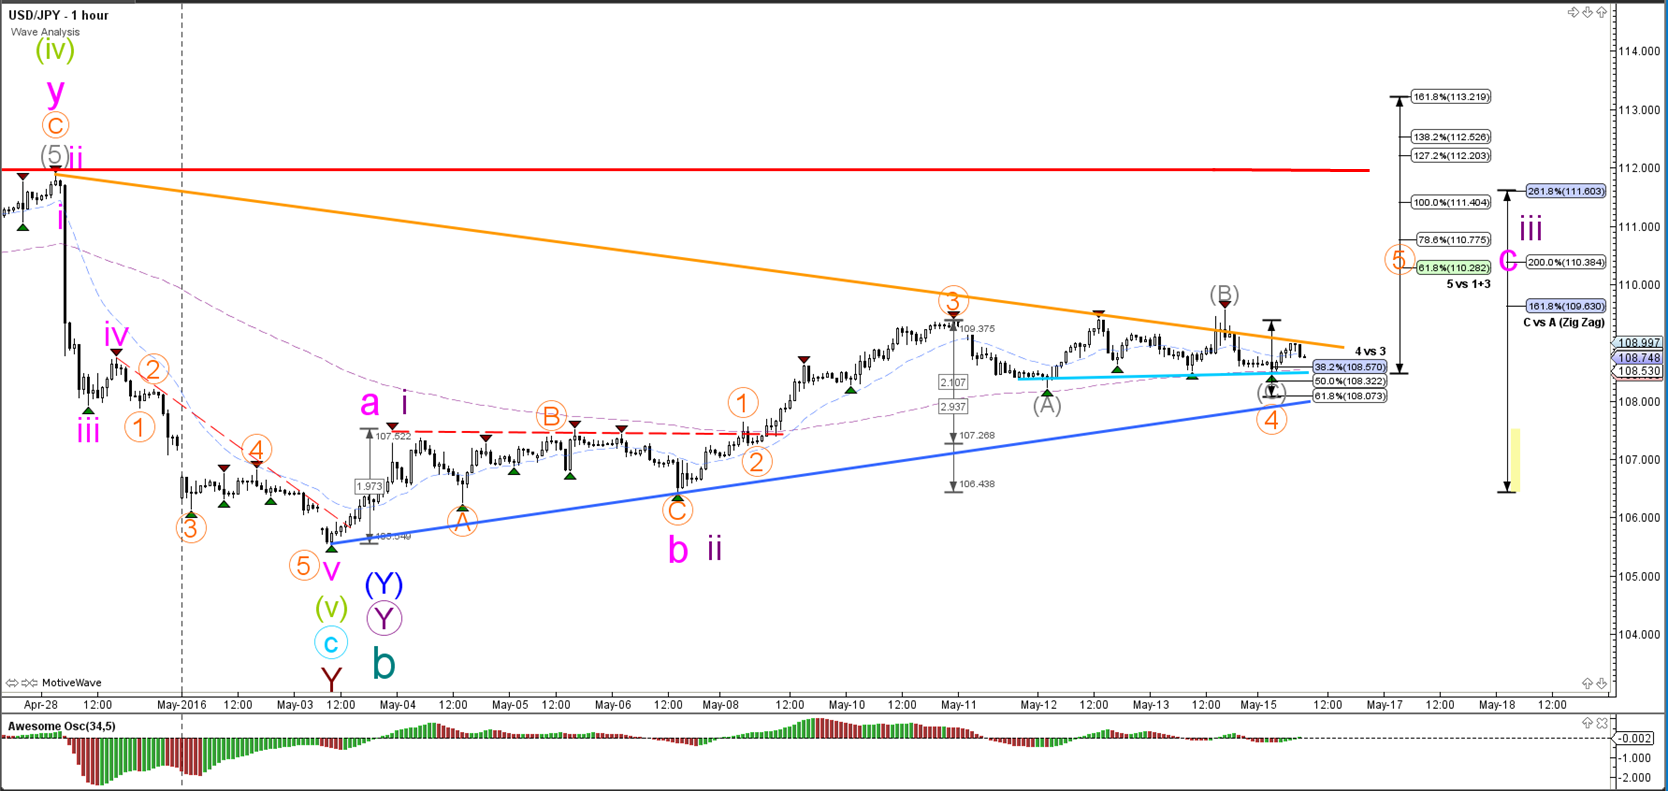
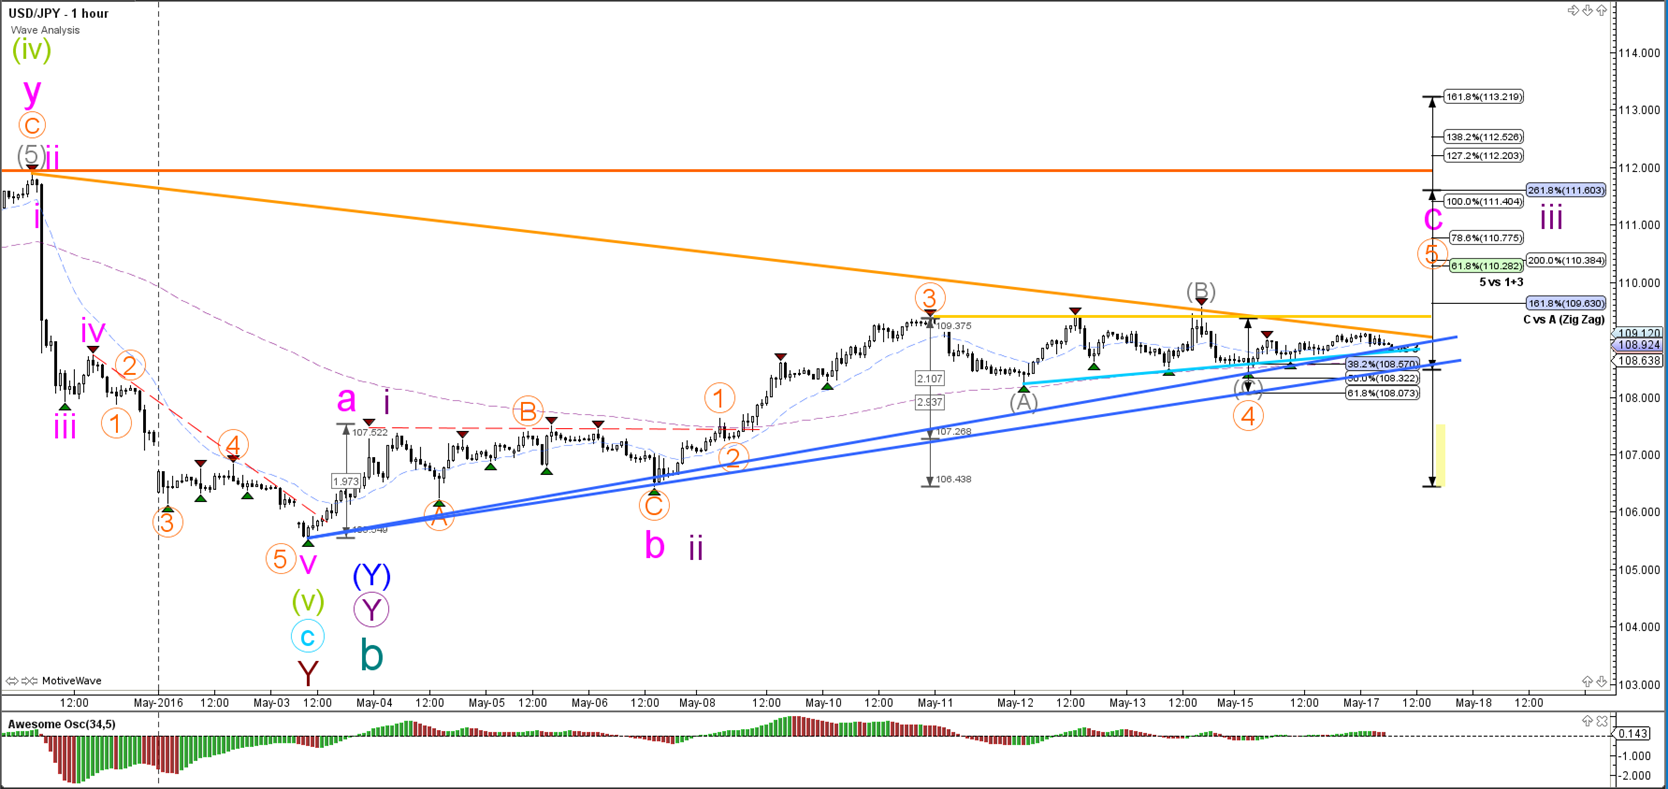
1 hour

The USD/JPY has respected the 61.8% Fibonacci level of wave B (purple). A break above the resistance trend line (red) could see the continuation of wave C. A break below support (blue) could see price fall towards the Fibonacci levels of B vs A or break the bottom and extend the downtrend.
“Original analysis is provided by Admiral Markets”
EUR/USD
4 hour
The EUR/USD completed the bullish wave C (blue) but the support trend lines (green) need to break before the waves Y of wave 4 (blue) can be considered completed. Until the trend lines break, the current bearish price action could still be a bearish retracement for an uptrend continuation.
1 hour
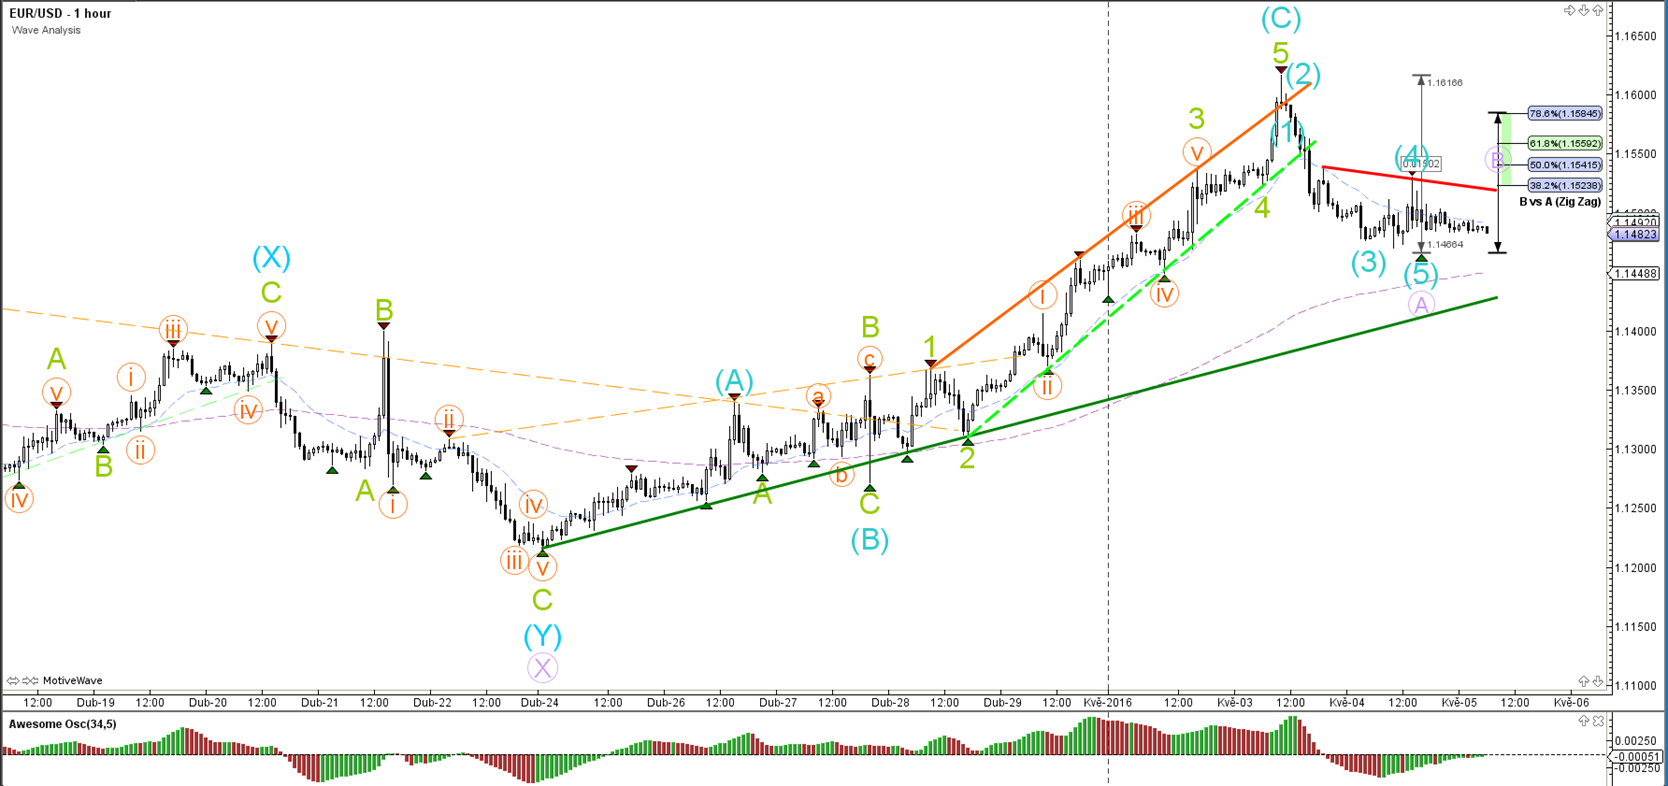
The EUR/USD seems to have completed a bearish wave 5 (blue) of wave A (purple). For the moment a bearish ABC zigzag (purple) seems the most logical path of least resistance for price. The wave count could turn into a 123 if price breaks below support.
GBP/USD
4 hour
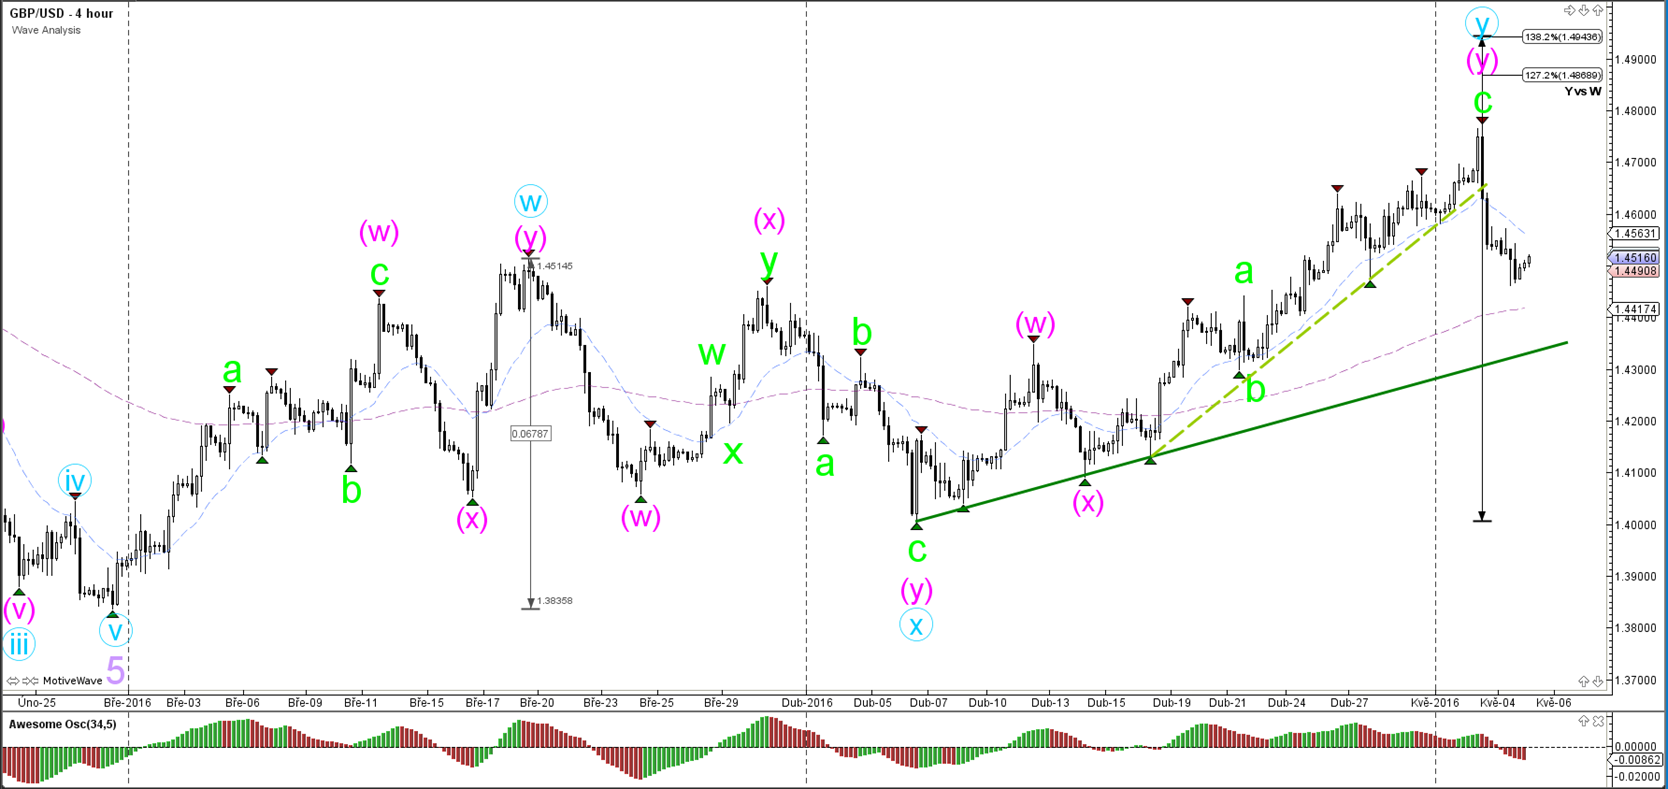
The GBP/USD broke the inner support trend line (dotted green) but has an outer and shallower support trend line remaining (solid green). A break of that support trend line would confirm the downtrend on the GBP/USD whereas a bounce at support could indicate an expansion of the uptrend.
1 hour

The GBP/USD completed a 5th wave (green) within wave A (pink). For the moment a wave B (pink) correction seems the most likely scenario unless price break below the channel.
USD/JPY
4 hour

The USD/JPY is showing a strong bullish bounce after breaking a resistance trend line (dotted red). The bullish price action could be a first signal that the US Dollar can make a decent rally.
1 hour
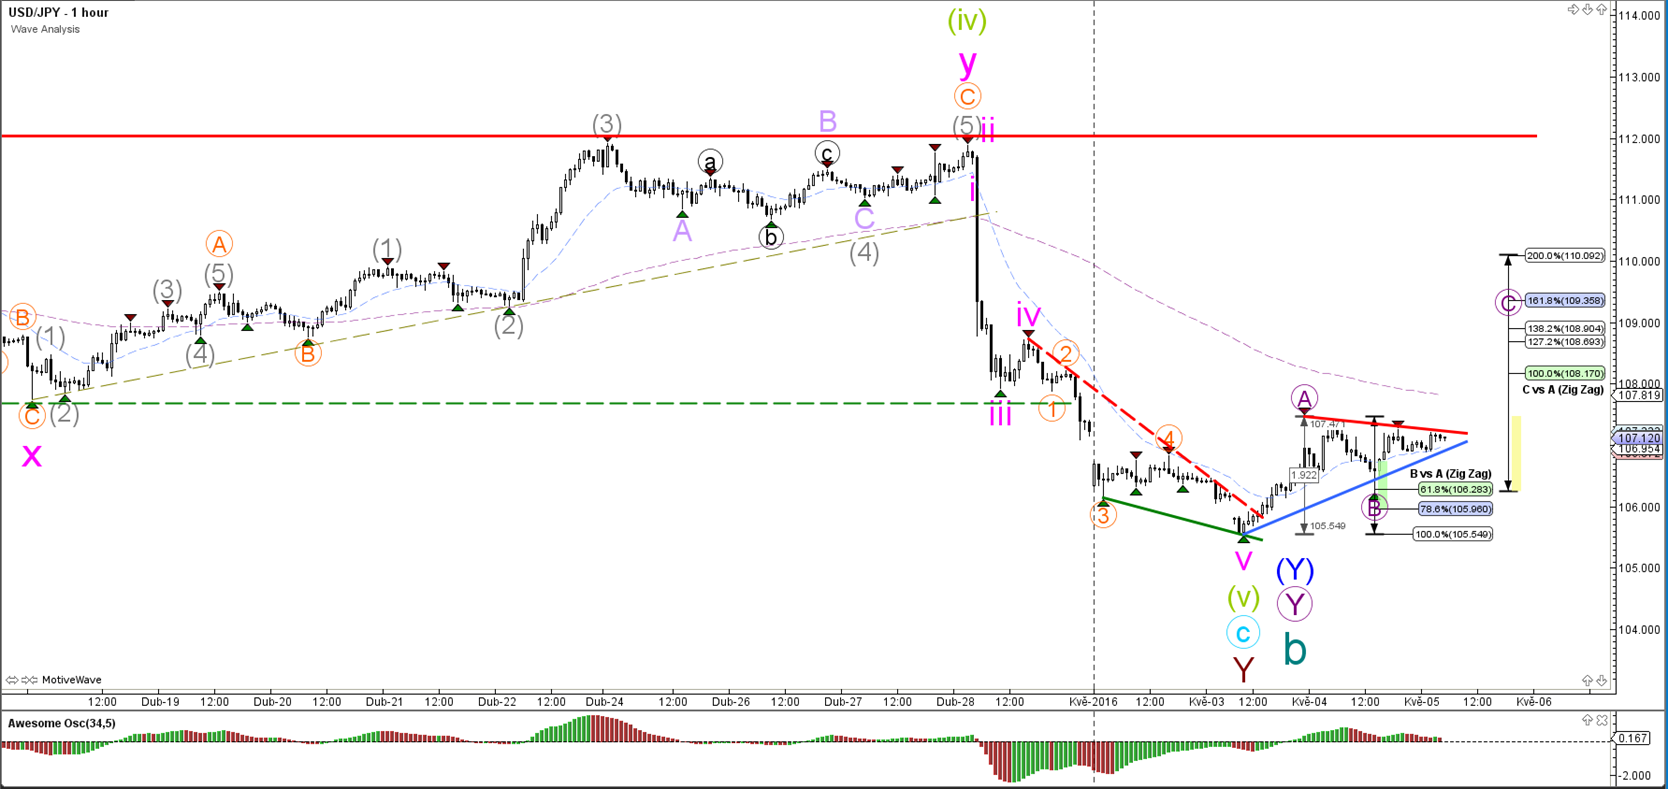
The USD/JPY has respected the 61.8% Fibonacci level of wave B (purple). A break above the resistance trend line (red) could see the continuation of wave C. A break below support (blue) could see price fall towards the Fibonacci levels of B vs A or break the bottom and extend the downtrend.
“Original analysis is provided by Admiral Markets”