GetKnowTrading
Recruit
- Messages
- 83
EURUSD Forecast – $1.06400 Bulls Target - Get Know Trading
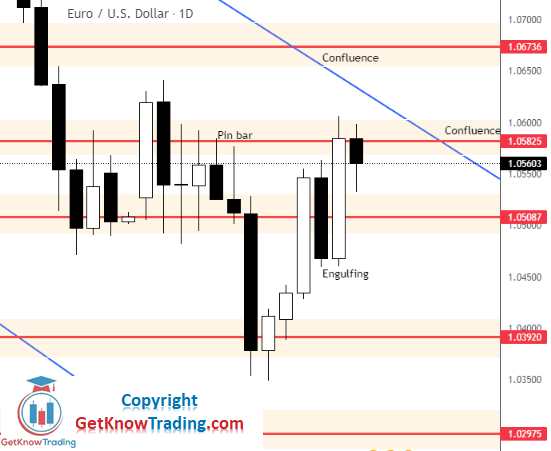
EURUSD Forecast – $1.06400 Bulls Target
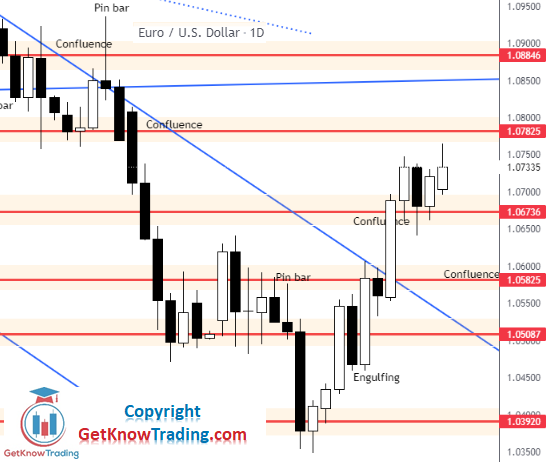
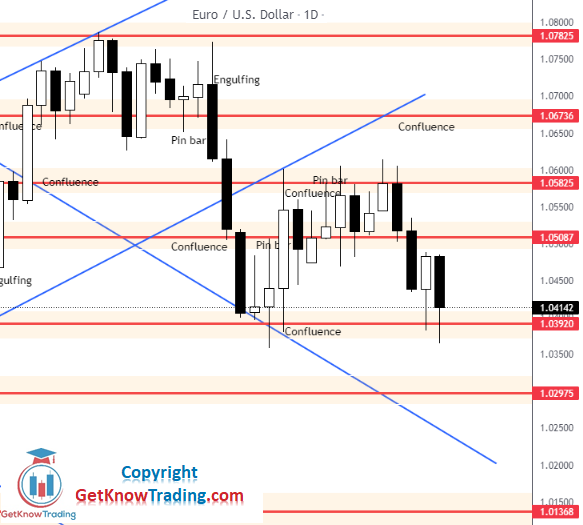
Just in two days the price returned and reached $1.04700.
On Friday we have a small retrace where traders have exited from trades and taken the profit from the strong move upwards.
With strong bullish candles and breaking some critical levels to the upside we can look for the price on higher levels.
The candle closed above previous candles body highs which is a good signal to look expect the price on the higher levels.