STRATEGIST
Private, 1st Class
- Messages
- 3
EUR/USD forecast
H4 graph
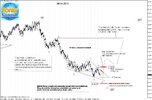
The pair is following a sideways trading pattern, partially leaving the “B-B+” daily downtrend. A potential of uptrend development emerged after the Friday payrolls release followed by getting to level 1.3620. The target of that potential uptrend would be found at level 1.3800. We may try to buy from 1.3820 with the target at 1.3800 and stop loss below 1.3560.

Daily graph
The pair is trading along the “F-F+” downtrend, however after the Friday payrolls release there appeared signs of an upside towards level 1.3805, which is the 4th (Elliot’s) wave. Upon getting to that level, the 5th down-trending wave is supposed to develop having the target at level 1.2870..

GBP/USD
H4 graph
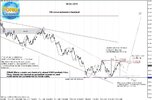
The pair rose above level 1.5130, which implies breaking of the “B-B+” downtrend. For this reason, in case the pair rises above level 1.5230, we should expect it to reach level 1.5410 (the 4th wave). We may try buying above 1.5130 with the target at 1.5410 and stop loss below 1.5090.

Daily graph
After rising above level 1.5130 the pair got a possibility to leave the “B-B+” downtrend. In case it will get over level 1.5230, the pair will reach its target level 1.5410 (the 4th Elliot wave, a correction wave). Upon the fact of reaching that level I expect a downtrend to develop having the drop target set at level 1.4350 (the 5th wave).
Alternatively, if wave picture fails and in case the pair rises above level 1.5550, then upon the fact of leaving the “F-F+” weekly downtrend the pair will get to level 1.6000 - the higher bound of the green downtrend.

H4 graph
The pair is following a sideways trading pattern, partially leaving the “B-B+” daily downtrend. A potential of uptrend development emerged after the Friday payrolls release followed by getting to level 1.3620. The target of that potential uptrend would be found at level 1.3800. We may try to buy from 1.3820 with the target at 1.3800 and stop loss below 1.3560.
Daily graph
The pair is trading along the “F-F+” downtrend, however after the Friday payrolls release there appeared signs of an upside towards level 1.3805, which is the 4th (Elliot’s) wave. Upon getting to that level, the 5th down-trending wave is supposed to develop having the target at level 1.2870..
GBP/USD
H4 graph
The pair rose above level 1.5130, which implies breaking of the “B-B+” downtrend. For this reason, in case the pair rises above level 1.5230, we should expect it to reach level 1.5410 (the 4th wave). We may try buying above 1.5130 with the target at 1.5410 and stop loss below 1.5090.
Daily graph
After rising above level 1.5130 the pair got a possibility to leave the “B-B+” downtrend. In case it will get over level 1.5230, the pair will reach its target level 1.5410 (the 4th Elliot wave, a correction wave). Upon the fact of reaching that level I expect a downtrend to develop having the drop target set at level 1.4350 (the 5th wave).
Alternatively, if wave picture fails and in case the pair rises above level 1.5550, then upon the fact of leaving the “F-F+” weekly downtrend the pair will get to level 1.6000 - the higher bound of the green downtrend.