Vladimir's Forex Signals and Mentoring

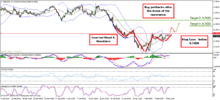
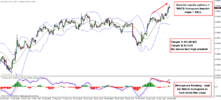
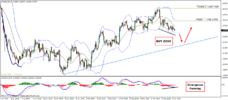
Buy in GBPUSD with hidden divergence

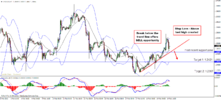
Vladimir Ribakov explains in his weekly video a great buy opportunity in the GBPUSD. Here is the plan.
Wait for the price to drop near the up trend line or a bit higher and upon completion of the H4 chart hidden bullish divergence along with regular bullish div on the H1 chart enter a buy a trade.
Target 1: 1.5280
Target 2: 1.5350
Target 3: 1.5550
Stop Loss: below 1.5060 GU H4.png
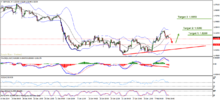
 
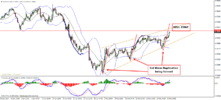
2 buy scenarios in NZDUSD

Vladimir Ribakov explains the 2 possible setups in the NZDUSD in his daily market video. Here is how to join if you are not already in.
Scenario 1: Wait for the break of the resistance zone around 0.7450 and then buy on the re-test.
Target 1: 0.7550
Target 2: 0.7630
Stop Loss: below 0.7450
NU H4 scenario 1.png

Scenario 2:
Buy dips on the intraday time frames
Target 1: 0.7440
Target 2: 0.7630
Stop Loss: below 0.7270
NU H1-m15.png
 
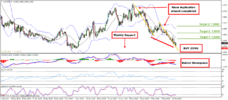
Get ready for strong push up in AUDNZD

Vladimir Ribakov explains the great buy opportunity in AUDNZD in his daily market analysis. Here is the plan to join:
Look for entry either on the H4 chart or the H1 chart. Check out Vlad's blog for full details and explanation of this entry.
H4 Scenario: Once the pair reaches the support zone around 1.0370 look for bullish candle pattern that will confirm the completion of the bullish divergence and enter
H1 Scenario: draw the most recent down trend line on the H1 chart when the price comes near the support mentioned above and look for a break.
Target 1: 1.0460
Target 2: 1.0515
Target 3: 1.0580
Stop Loss: below 1.0350
AN H4 final.png
 
Sell NZDUSD in the short term before continuation up

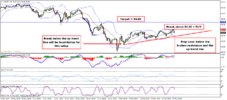
Vladimir Ribakov explains the short term sell opportunity in his weekly market analysis. The plan is to short the pair near the up trend line that was recently broken preferably after a double wave correction up.
Target 1: 1.2360
Target 2: opposite bollinger band on the D1 chart
SL: above the resistance and down trend line (h1)
UC H1.png
 
Sell the break of the up trend line in USDCAD

Vladimir Ribakov continues to follow the trade setup in USDCAD. Plan is the same. Wait for break of the up trend line and enter either with the momentum or wait for re-test of the break to confirm and then short.
Target 1: 1.2467
Target 2: 1.2336
Stop Loss: above the last high created before the break

UC H1.png
 
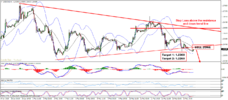
Anticipating a break above the resistance in AUDJPY

Vladimir Ribakov shares a very good trading setup in the AUDJPY.
Price is trading inside a wedge/triangle formation. We better wait for break above the resistance at 93.40-50 and only after confirmation go ahead and buy. We must protect the broken zone and the up trend line. First target at 94.80 second target is open.

Here is a screenshot of the trading plan:aj h4 entry.png
 
USDCAD forming great buy opportunity

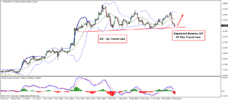
Vladimir Ribakov suggests a great buy opportunity on the USDCAD in his daily video analysis. Here is the plan on how to join:
Follow the H4 chart up trend line on the H1 chart. We need one more higher low on the MACD in order for the divergence to be completed and then we can look for bullish candle pattern to enter the trade. Additional details and explanation on this trade setup could be found in the original blog post of vlad.
Target 1: 1.2445
Target 2: 1.2500
Stop Loss: Below last low createdUC H1.pngUC H4.png
 
NZDUSD sell opportunity

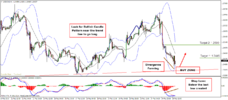
Vladimir RIbakov covers the sell setup in his daily video in NZDUSD. Here's the plan on how to join. You check the blog for more details or the youtube channel for video explanation of the trade setup.
Price is currently moving in descending channel (check H4), there is also divergence forming on the H1 chart and we are near the top of the channel. Idea is to confirm the bearish divergence with MACD histogram once completed and with bearish candle pattern, then we can sell.
Target 1: H4 20 MA
Target 2: 0.7440
SL: above last high createdNU H1.pngNU H4.png
 
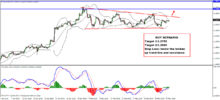
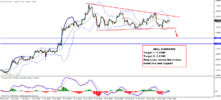
Vladimir Ribakov explains the USDCAD setups that are being formed in his weekly video. Here is the plan on how to join (for full details Vlad's blog or the youtube channel where you can find the video explanation)
USDCAD is trading inside a triangle/wedge formation. Break above or below will be our trigger for either buy or sell. You can look for entry either on the H1/H4 charts.

BUY SCENARIO
Target 1: 1.2750
Target 2: 1.2900
Stop Loss: below the broken up trend line and resistance
UC H4 Buy.png

SELL SCENARIO
Target 1: 1.2200
Target 2: 1.2100
Stop Loss: above broken trend line and support
UC H4 Sell.png
 
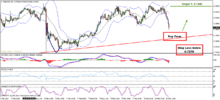
Long opportunity in GBPUSD forming

Vladimir Ribakov explains the buy opportunity forming on the cable in his daily market analysis. Here is the plan to join.
There is divergence forming on the H4 and up trend line coming from the lows
Wait for price to fall a bit lower near the support range 1.5290-1.5210 than on the M15 or H1 charts look for any possible trigger. That could be divergence, patterns (flag/wedge), trend line break etc
Target 1: Gap Zone near 1.5435
Target 2: Last High near 1.5540
Stop Loss: below the up trend line and support
GU H4.png
 
Back
Top