FXOpen Trader
Private, 1st Class
- Messages
- 31
Gold Price Aims More Gains, Crude Oil Price Could Resume Decline
Gold price is showing positive signs above the $1,800 level. Crude oil price is struggling below $80 and might resume its decline.
Important Takeaways for Gold and Oil
Gold Price Technical Analysis
Gold price attempted an upside break above the $1,825 resistance zone against the US Dollar. The price even cleared the $1,830 level, but the bears were active near the $1,832 zone.
A high was formed near $1,833 and the price started a fresh decline. There was a clear move below the $1,810 and $1,805 support levels. The price traded as low as $1,797 and recently started a fresh increase.
Gold Price Hourly Chart
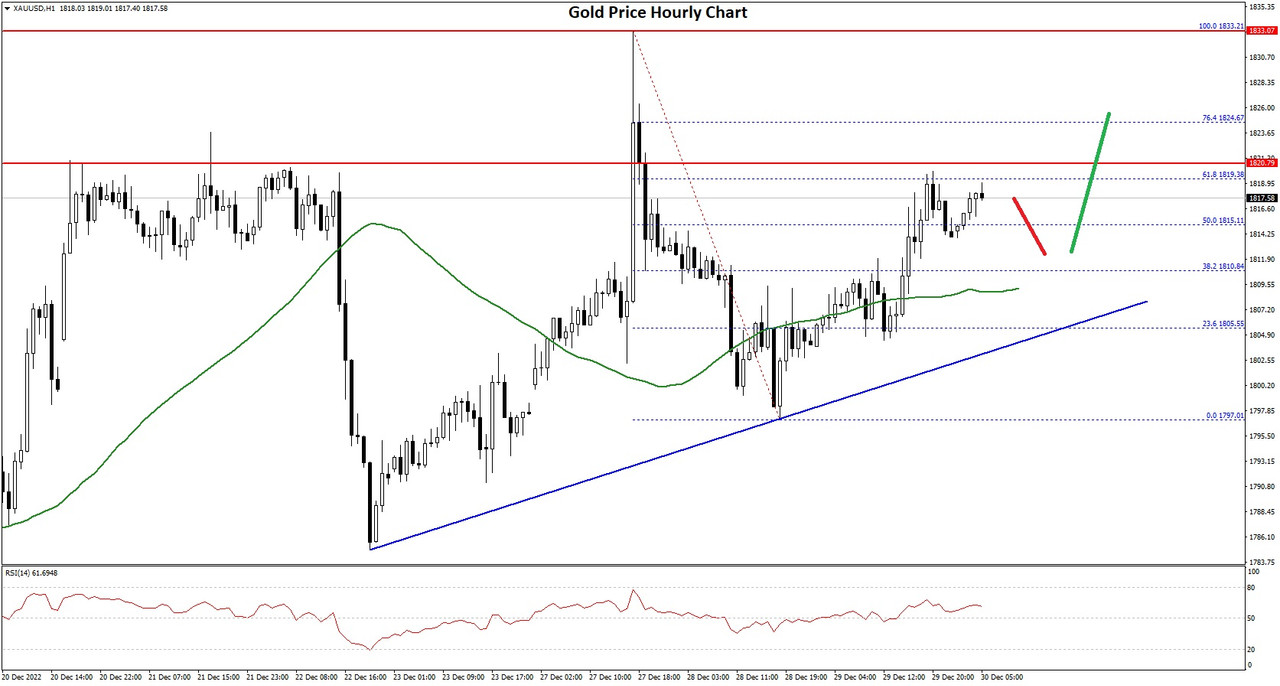
There was a clear move above the $1,805 level and the 50 hourly simple moving average. The price even surpassed the 50% Fib retracement level of the downward move from the $1,833 swing high to $1,798 swing low.
Besides, there is a key bullish trend line forming with support near $1,808 on the hourly chart of gold. On the upside, the first major resistance is near the $1,820 level. It is near the 61.8% Fib retracement level of the downward move from the $1,833 swing high to $1,798 swing low.
The next key hurdle is near the $1,832 level, above which it could even test $1,850. A clear upside break above the $1,850 resistance could send the price towards $1,880.
An immediate support on the downside is near the $1,808 level. The next major support is near the $1,800 level, below which there is a risk of a larger decline. In the stated case, the price could decline sharply towards the $1,765 support zone.
VIEW FULL ANALYSIS VISIT - FXOpen Blog...
Disclaimer: This forecast represents FXOpen Companies opinion only, it should not be construed as an offer, invitation or recommendation in respect to FXOpen Companies products and services or as financial advice.
Gold price is showing positive signs above the $1,800 level. Crude oil price is struggling below $80 and might resume its decline.
Important Takeaways for Gold and Oil
- Gold price faced resistance near $1,832 and corrected lower against the US Dollar.
- There is a key bullish trend line forming with support near $1,808 on the hourly chart of gold.
- Crude oil price started a fresh decline from the $82.00 resistance zone.
- There was a break below a major bullish trend line with support near $79.75 on the hourly chart of XTI/USD.
Gold Price Technical Analysis
Gold price attempted an upside break above the $1,825 resistance zone against the US Dollar. The price even cleared the $1,830 level, but the bears were active near the $1,832 zone.
A high was formed near $1,833 and the price started a fresh decline. There was a clear move below the $1,810 and $1,805 support levels. The price traded as low as $1,797 and recently started a fresh increase.
Gold Price Hourly Chart
There was a clear move above the $1,805 level and the 50 hourly simple moving average. The price even surpassed the 50% Fib retracement level of the downward move from the $1,833 swing high to $1,798 swing low.
Besides, there is a key bullish trend line forming with support near $1,808 on the hourly chart of gold. On the upside, the first major resistance is near the $1,820 level. It is near the 61.8% Fib retracement level of the downward move from the $1,833 swing high to $1,798 swing low.
The next key hurdle is near the $1,832 level, above which it could even test $1,850. A clear upside break above the $1,850 resistance could send the price towards $1,880.
An immediate support on the downside is near the $1,808 level. The next major support is near the $1,800 level, below which there is a risk of a larger decline. In the stated case, the price could decline sharply towards the $1,765 support zone.
VIEW FULL ANALYSIS VISIT - FXOpen Blog...
Disclaimer: This forecast represents FXOpen Companies opinion only, it should not be construed as an offer, invitation or recommendation in respect to FXOpen Companies products and services or as financial advice.