FXOpen Trader
Private, 1st Class
- Messages
- 31
GBP/USD and GBP/JPY Could Extend Losses
GBP/USD started a major decline and traded below 1.1500. GBP/JPY is consolidating above the 160.80 support, with a bearish angle.
Important Takeaways for GBP/USD and GBP/JPY
GBP/USD Technical Analysis
This past week, the British Pound started a major decline from the 1.1880 zone against the US Dollar. The GBP/USD pair declined below the 1.1800 support to move into a bearish zone.
There was a steady decline below the 1.1700 level and the 50 hourly simple moving average. The pair even traded below the 1.1620 support zone. The pair traded as low as 1.1460 on FXOpen and is currently consolidating losses.
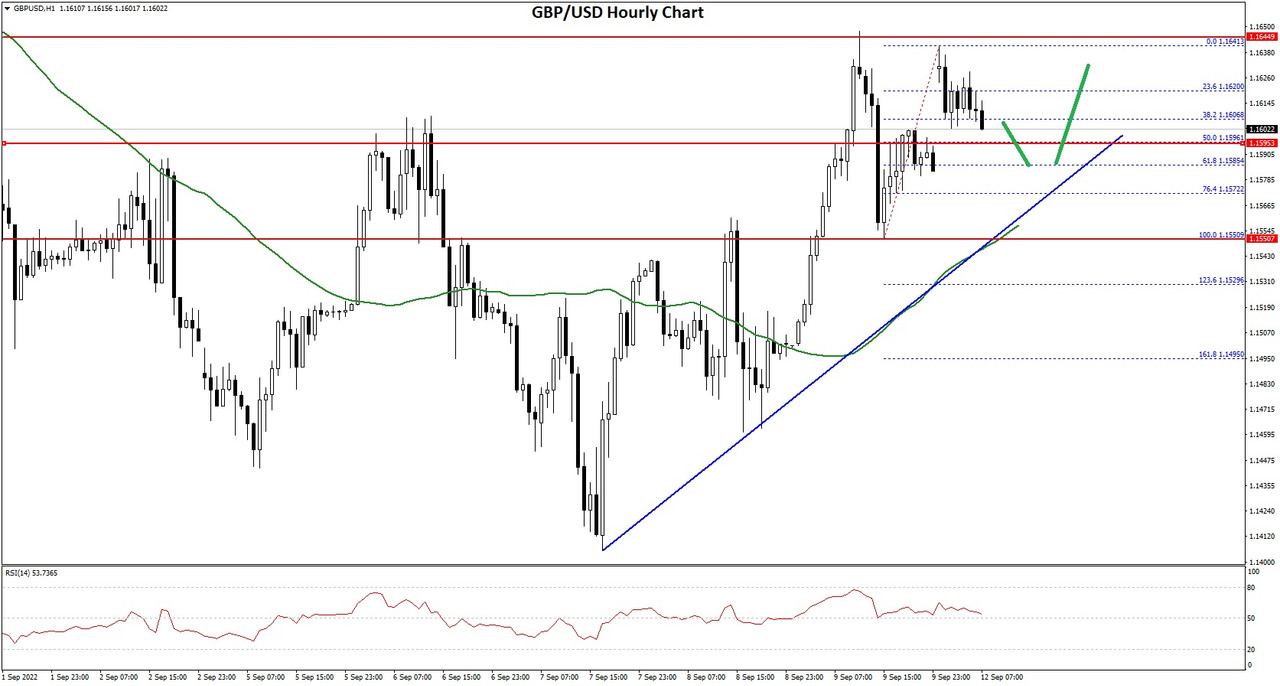
GBP/USD Hourly Chart
An immediate resistance on the upside is near the 1.1510 level. It is near the 38.2% Fib retracement level of the recent decline from the 1.1588 swing high to 1.1460 level.
The next major resistance is near the 1.1520 level and the 50 hourly simple moving average. There is also a major bearish trend line forming with resistance near 1.1520 on the hourly chart of GBP/USD. The trend line is near the 50% Fib retracement level of the recent decline from the 1.1588 swing high to 1.1460 level.
An upside break above 1.1520 might start a fresh increase towards 1.1550. Any more gains might call for a move towards 1.1585 or even 1.1620. An immediate support is near the 1.1460. The next major support is near the 1.1400 level.
If there is a break below the 1.1400 support, the pair could test the 1.1350 support. Any more losses might send GBP/USD towards 1.1300.
VIEW FULL ANALYSIS VISIT - FXOpen Blog...
GBP/USD started a major decline and traded below 1.1500. GBP/JPY is consolidating above the 160.80 support, with a bearish angle.
Important Takeaways for GBP/USD and GBP/JPY
- The British Pound started a major decline below the 1.1620 support against the US Dollar.
- There is a major bearish trend line forming with resistance near 1.1520 on the hourly chart of GBP/USD.
- GBP/JPY declined steadily after it failed to clear the 162.50 resistance zone.
- There was a break below a key bullish trend line with support near 161.15 on the hourly chart.
GBP/USD Technical Analysis
This past week, the British Pound started a major decline from the 1.1880 zone against the US Dollar. The GBP/USD pair declined below the 1.1800 support to move into a bearish zone.
There was a steady decline below the 1.1700 level and the 50 hourly simple moving average. The pair even traded below the 1.1620 support zone. The pair traded as low as 1.1460 on FXOpen and is currently consolidating losses.
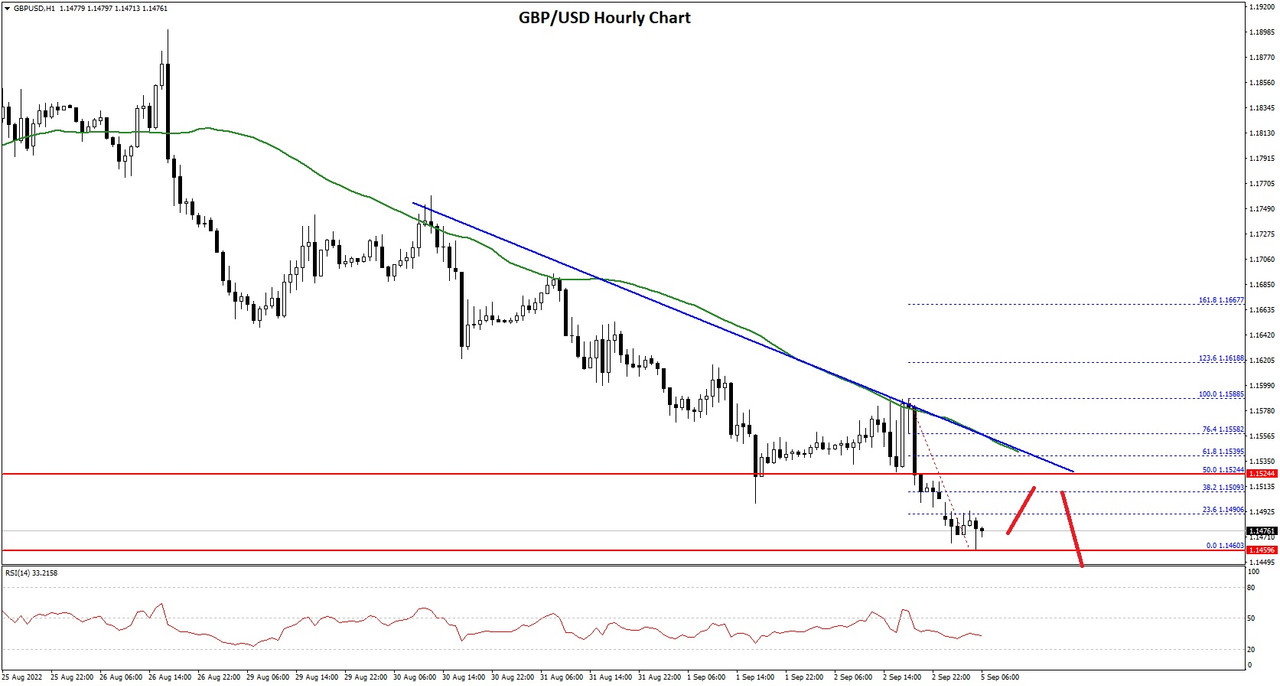
GBP/USD Hourly Chart
An immediate resistance on the upside is near the 1.1510 level. It is near the 38.2% Fib retracement level of the recent decline from the 1.1588 swing high to 1.1460 level.
The next major resistance is near the 1.1520 level and the 50 hourly simple moving average. There is also a major bearish trend line forming with resistance near 1.1520 on the hourly chart of GBP/USD. The trend line is near the 50% Fib retracement level of the recent decline from the 1.1588 swing high to 1.1460 level.
An upside break above 1.1520 might start a fresh increase towards 1.1550. Any more gains might call for a move towards 1.1585 or even 1.1620. An immediate support is near the 1.1460. The next major support is near the 1.1400 level.
If there is a break below the 1.1400 support, the pair could test the 1.1350 support. Any more losses might send GBP/USD towards 1.1300.
VIEW FULL ANALYSIS VISIT - FXOpen Blog...