FxGrow Support
Recruit
- Messages
- 58
Daily Technical Analysis – 21st May, 2015
By FxGrow Research & Analysis Team
EURUSD
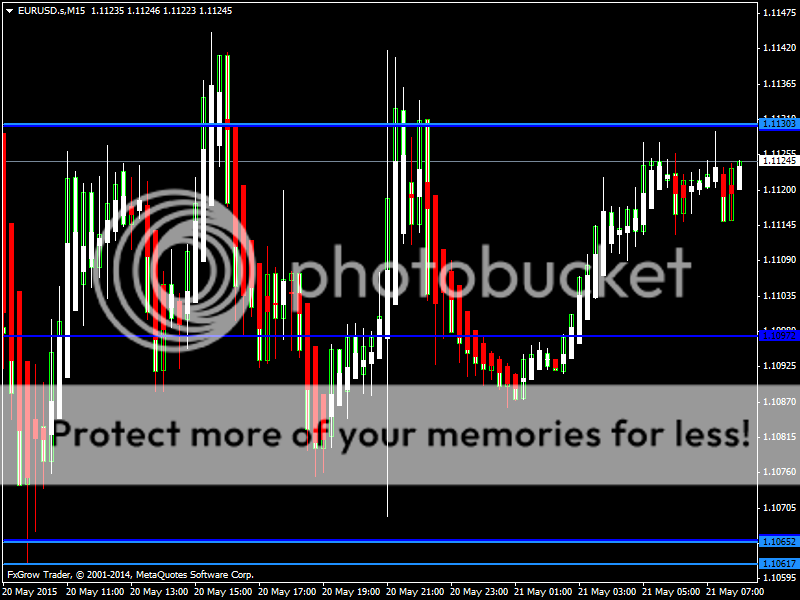
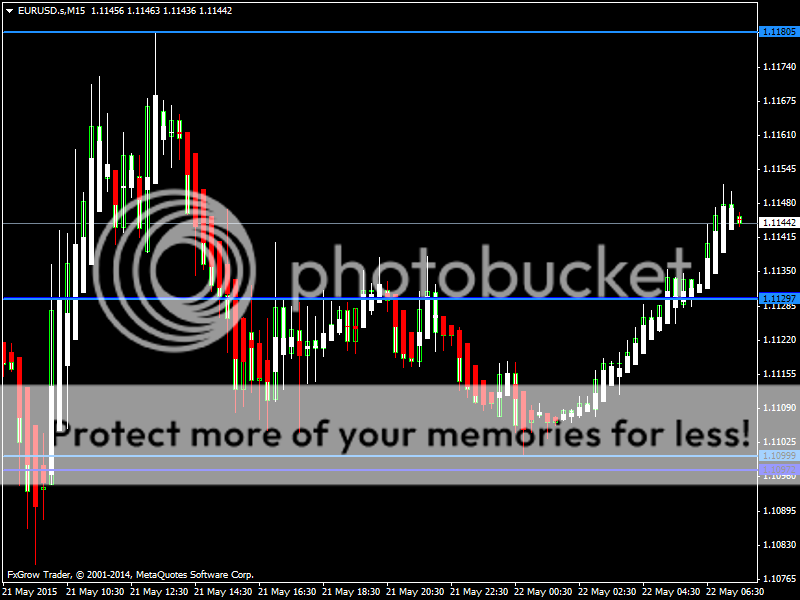
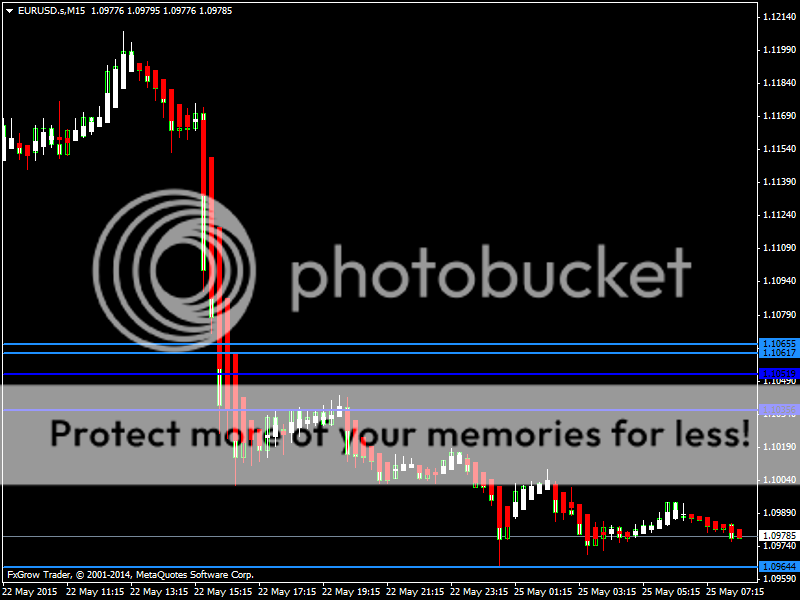
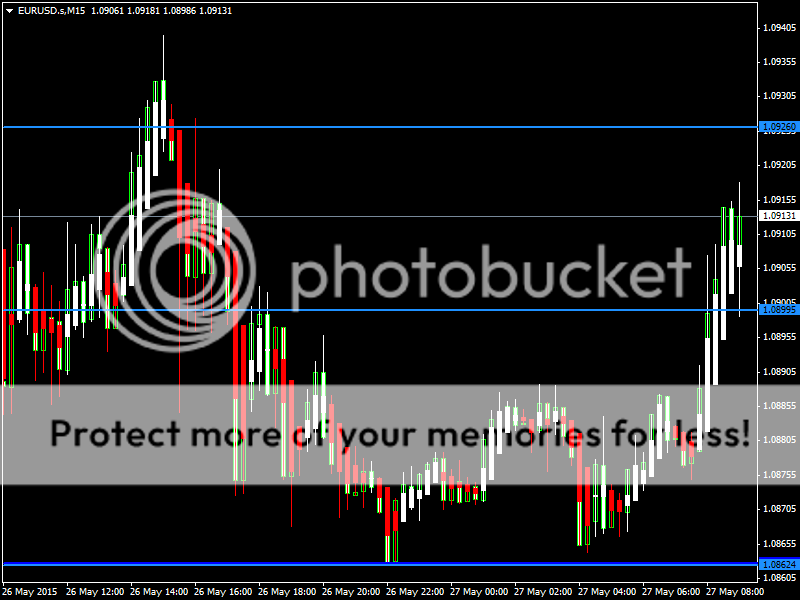
EURUSD remained indecisive yesterday but closed lower at 1.1091 In the Asian trading session the pair is in a Bullish momentum and the near term bias remains bullish with targets of 1.1200 to 1.1250
STOCH(9,6), ADX (14), CCI (14), ROC indicate a BUY; STOCHRSI(14) is Overbought; while Average True Range (14) indicates Less Volatility.
Support is at 1.1061 while Resistance is at 1.1130
21st May 2015 – 05:07hrs GMT
GBPUSD
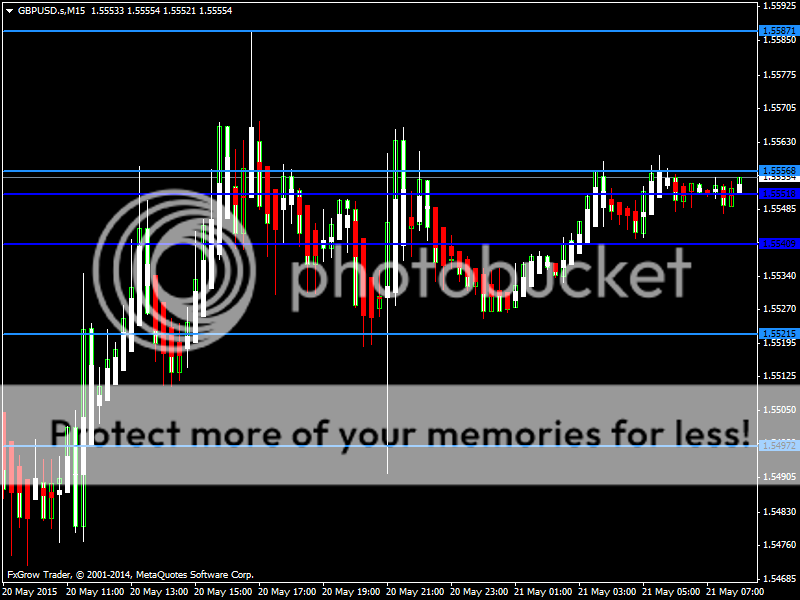
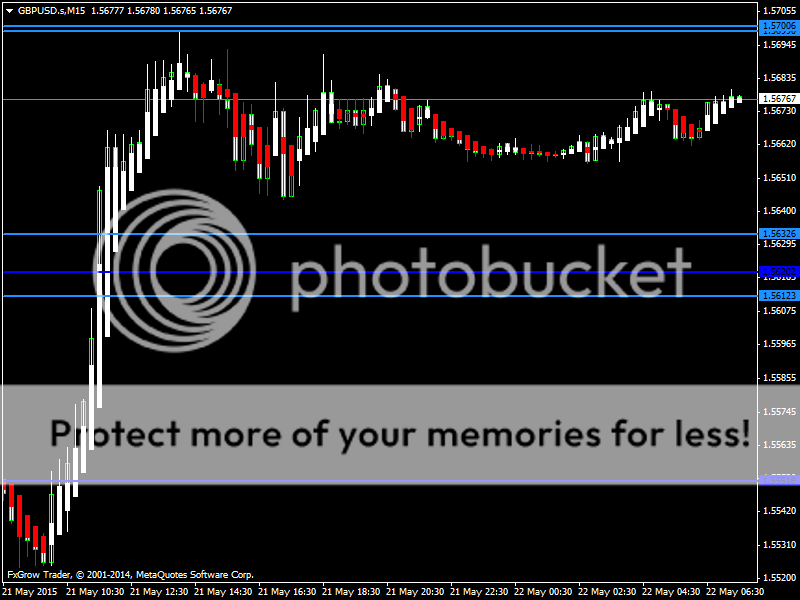
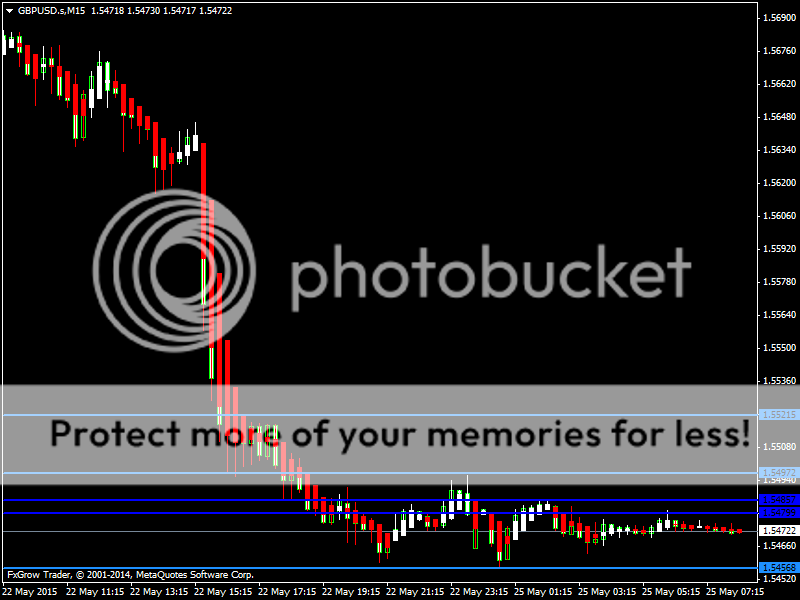
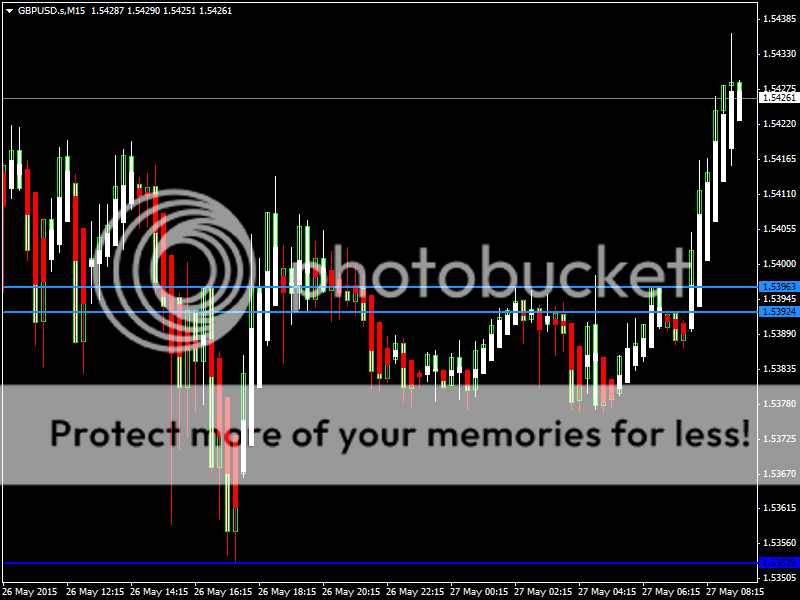
GBPUSD remained sideways yesterday and is trading above the 20 day moving average. The near term bias remains bullish with targets of 1.5590 to 1.5620
RSI (14), MACD (12, 26), ROC, ADX (14) indicate a BUY; STOCHRSI (14) is Overbought; while Average True Range (14) indicates Less Volatility.
Support is at 1.5497 while Resistance is at 1.5587
21st May 2015 – 05:14hrs GMT
For more in depth Research & Analysis please visit FxGrow.
Note: This analysis is intended to provide general information and does not constitute the provision of INVESTMENT ADVICE. Investors should, before acting on this information, consider the appropriateness of this information having regard to their personal objectives, financial situation or needs. We recommend investors obtain investment advice specific to their situation before making any financial investment decision.
By FxGrow Research & Analysis Team
EURUSD
EURUSD remained indecisive yesterday but closed lower at 1.1091 In the Asian trading session the pair is in a Bullish momentum and the near term bias remains bullish with targets of 1.1200 to 1.1250
STOCH(9,6), ADX (14), CCI (14), ROC indicate a BUY; STOCHRSI(14) is Overbought; while Average True Range (14) indicates Less Volatility.
Support is at 1.1061 while Resistance is at 1.1130
21st May 2015 – 05:07hrs GMT
GBPUSD
GBPUSD remained sideways yesterday and is trading above the 20 day moving average. The near term bias remains bullish with targets of 1.5590 to 1.5620
RSI (14), MACD (12, 26), ROC, ADX (14) indicate a BUY; STOCHRSI (14) is Overbought; while Average True Range (14) indicates Less Volatility.
Support is at 1.5497 while Resistance is at 1.5587
21st May 2015 – 05:14hrs GMT
For more in depth Research & Analysis please visit FxGrow.
Note: This analysis is intended to provide general information and does not constitute the provision of INVESTMENT ADVICE. Investors should, before acting on this information, consider the appropriateness of this information having regard to their personal objectives, financial situation or needs. We recommend investors obtain investment advice specific to their situation before making any financial investment decision.